BP 2009 Annual Report Download - page 192
Download and view the complete annual report
Please find page 192 of the 2009 BP annual report below. You can navigate through the pages in the report by either clicking on the pages listed below, or by using the keyword search tool below to find specific information within the annual report.-
 1
1 -
2
-
3
-
4
-
5
-
6
-
7
-
8
-
9
-
10
-
11
-
12
-
13
-
14
-
15
-
16
-
17
-
18
-
19
-
20
-
21
-
22
-
23
-
24
-
25
-
26
-
27
-
28
-
29
-
30
-
31
-
32
-
33
-
34
-
35
-
36
-
37
-
38
-
39
-
40
-
41
-
42
-
43
-
44
-
45
-
46
-
47
-
48
-
49
-
50
-
51
-
52
-
53
-
54
-
55
-
56
-
57
-
58
-
59
-
60
-
61
-
62
-
63
-
64
-
65
-
66
-
67
-
68
-
69
-
70
-
71
-
72
-
73
-
74
-
75
-
76
-
77
-
78
-
79
-
80
-
81
-
82
-
83
-
84
-
85
-
86
-
87
-
88
-
89
-
90
-
91
-
92
-
93
-
94
-
95
-
96
-
97
-
98
-
99
-
100
-
101
-
102
-
103
-
104
-
105
-
106
-
107
-
108
-
109
-
110
-
111
-
112
-
113
-
114
-
115
-
116
-
117
-
118
-
119
-
120
-
121
-
122
-
123
-
124
-
125
-
126
-
127
-
128
-
129
-
130
-
131
-
132
-
133
-
134
-
135
-
136
-
137
-
138
-
139
-
140
-
141
-
142
-
143
-
144
-
145
-
146
-
147
-
148
-
149
-
150
-
151
-
152
-
153
-
154
-
155
-
156
-
157
-
158
-
159
-
160
-
161
-
162
-
163
-
164
-
165
-
166
-
167
-
168
-
169
-
170
-
171
-
172
-
173
-
174
-
175
-
176
-
177
-
178
-
179
-
180
-
181
-
 182
182 -
 183
183 -
 184
184 -
 185
185 -
 186
186 -
 187
187 -
 188
188 -
 189
189 -
 190
190 -
 191
191 -
 192
192 -
 193
193 -
 194
194 -
 195
195 -
 196
196 -
 197
197 -
 198
198 -
 199
199 -
 200
200 -
 201
201 -
 202
202 -
203
-
204
-
205
-
206
-
207
-
208
-
209
-
210
-
211
-
212
 |
 |

190
BP Annual Report and Accounts 2009
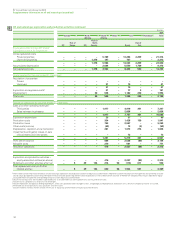
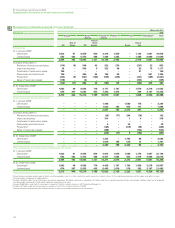
Supplementary information on oil and natural gas (unaudited)
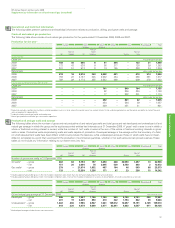
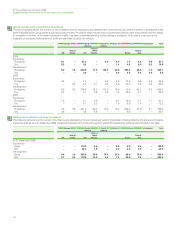
Standardized measure of discounted future net cash flows and changes therein relating to proved oil and gas reserves continued
$ million
Europe North South Africa Asia Australasia Total
America America
Rest of
Rest of North Rest of
UK Europe US America Russia Asia
At 31 December 2008
Subsidiaries
Future cash inflowsa36,400 13,800 165,800 6,400 26,300 40,400 – 31,400 24,200 344,700
Future production costb18,100 6,300 80,400 2,700 7,200 11,600 – 11,800 10,700 148,800
Future development costb3,300 2,900 25,600 1,300 7,200 10,900 – 7,500 3,200 61,900
Future taxationc7,300 2,300 17,500 500 5,500 6,600 – 2,400 2,800 44,900
Future net cash flows 7,700 2,300 42,300 1,900 6,400 11,300 – 9,700 7,500 89,100
10% annual discountd2,200 1,200 21,000 1,000 2,900 5,500 – 4,200 3,900 41,900
Standardized measure of discounted
future net cash flowse5,500 1,100 21,300 900 3,500 5,800 – 5,500 3,600 47,200
Equity-accounted entities (BP share)g
Standardized measure of discounted
future net cash flowsh––––3,600 – 4,800 900 – 9,300
Total subsidiaries and equity-accounted entities
Standardized measure of discounted
future net cash flowse5,500 1,100 21,300 900 7,100 5,800 4,800 6,400 3,600 56,500
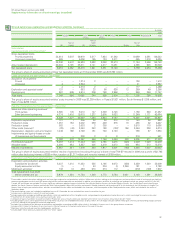
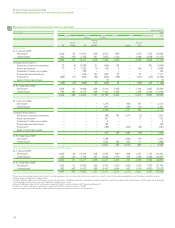
At 31 December 2007
Subsidiaries
Future cash inflowsa72,100 29,500 350,100 7,500 60,200 63,300 – 55,100 41,900 679,700
Future production costb27,500 7,500 109,800 3,000 14,900 9,900 – 9,700 11,600 193,900
Future development costb4,000 3,300 21,900 700 5,800 8,300 – 3,900 3,700 51,600
Future taxationc20,200 13,000 71,600 900 20,800 17,100 – 9,800 8,600 162,000
Future net cash flows 20,400 5,700 146,800 2,900 18,700 28,000 – 31,700 18,000 272,200
10% annual discountd6,500 2,800 76,000 1,300 8,200 9,400 – 12,600 9,200 126,000
Standardized measure of discounted
future net cash flowse13,900 2,900 70,800 1,600 10,500 18,600 – 19,100 8,800 146,200
Equity-accounted entities (BP share)g
Standardized measure of discounted
future net cash flowsh––––5,000 – 21,700 3,000 – 29,700
Total subsidiaries and equity-accounted entities
Standardized measure of discounted
future net cash flowse13,900 2,900 70,800 1,600 15,500 18,600 21,700 22,100 8,800 175,900
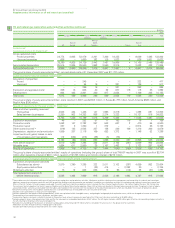
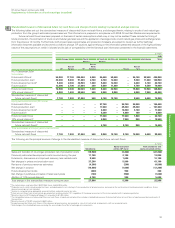
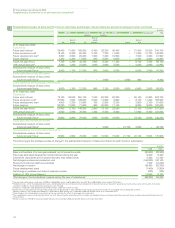
The following are the principal sources of change in the standardized measure of discounted future net cash flows for subsidiaries:
$ million
2008 2007
Sales and transfers of oil and gas produced, net of production costs (43,600) (28,300)
Previously estimated development costs incurred during the year 9,400 9,400
Extensions, discoveries and improved recovery, less related costs 4,400 12,300
Net changes in prices and production cost (146,800) 102,100
Revisions of previous reserves estimates 1,200 (12,200)
Net change in taxation 69,400 (28,300)
Future development costs (7,400) (7,800)
Net change in purchase and sales of reserves-in-place (200) (700)
Addition of 10% annual discount 14,600 9,100
Total change in the standardized measure during the year of subsidiariesf(99,000) 55,600
aThe year-end marker prices used were 2008 Brent $36.55/bbl, Henry Hub $5.63/mmBtu and 2007 Brent $96.02/bbl, Henry Hub $7.10/mmBtu.
bProduction costs, which include production taxes, and development costs relating to future production of proved reserves are based on year-end cost levels and assume continuation of existing
economic conditions. Future decommissioning costs are included.
cTaxation is computed using appropriate year-end statutory corporate income tax rates.
dFuture net cash flows from oil and natural gas production are discounted at 10% regardless of the group assessment of the risk associated with its producing activities.
eMinority interest in BP Trinidad and Tobago LLC amounted to $900 million at 31 December 2008 and $2,300 million at 31 December 2007.
fTotal change in the standardized measure during the year includes the effect of exchange rate movements.
gThe standardized measure of discounted future net cash flows of equity-accounted entities includes standardized measure of discounted future net cash flows of equity-acccounted investments of
those entities.
hMinority interest in TNK-BP amounted to $300 million at 31 December 2008 and $1,400 million at 31 December 2007.