BP 2009 Annual Report Download - page 202
Download and view the complete annual report
Please find page 202 of the 2009 BP annual report below. You can navigate through the pages in the report by either clicking on the pages listed below, or by using the keyword search tool below to find specific information within the annual report.-
 1
1 -
2
-
3
-
4
-
5
-
6
-
7
-
8
-
9
-
10
-
11
-
12
-
13
-
14
-
15
-
16
-
17
-
18
-
19
-
20
-
21
-
22
-
23
-
24
-
25
-
26
-
27
-
28
-
29
-
30
-
31
-
32
-
33
-
34
-
35
-
36
-
37
-
38
-
39
-
40
-
41
-
42
-
43
-
44
-
45
-
46
-
47
-
48
-
49
-
50
-
51
-
52
-
53
-
54
-
55
-
56
-
57
-
58
-
59
-
60
-
61
-
62
-
63
-
64
-
65
-
66
-
67
-
68
-
69
-
70
-
71
-
72
-
73
-
74
-
75
-
76
-
77
-
78
-
79
-
80
-
81
-
82
-
83
-
84
-
85
-
86
-
87
-
88
-
89
-
90
-
91
-
92
-
93
-
94
-
95
-
96
-
97
-
98
-
99
-
100
-
101
-
102
-
103
-
104
-
105
-
106
-
107
-
108
-
109
-
110
-
111
-
112
-
113
-
114
-
115
-
116
-
117
-
118
-
119
-
120
-
121
-
122
-
123
-
124
-
125
-
126
-
127
-
128
-
129
-
130
-
131
-
132
-
133
-
134
-
135
-
136
-
137
-
138
-
139
-
140
-
141
-
142
-
143
-
144
-
145
-
146
-
147
-
148
-
149
-
150
-
151
-
152
-
153
-
154
-
155
-
156
-
157
-
158
-
159
-
160
-
161
-
162
-
163
-
164
-
165
-
166
-
167
-
168
-
169
-
170
-
171
-
172
-
173
-
174
-
175
-
176
-
177
-
178
-
179
-
180
-
181
-
182
-
183
-
184
-
185
-
186
-
187
-
188
-
189
-
190
-
191
-
 192
192 -
 193
193 -
 194
194 -
 195
195 -
 196
196 -
 197
197 -
 198
198 -
 199
199 -
 200
200 -
 201
201 -
 202
202 -
 203
203 -
 204
204 -
 205
205 -
 206
206 -
 207
207 -
 208
208 -
 209
209 -
 210
210 -
 211
211 -
 212
212
 |
 |

BP Annual Report and Accounts 2009
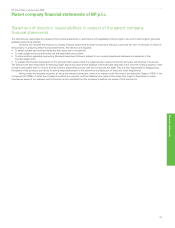
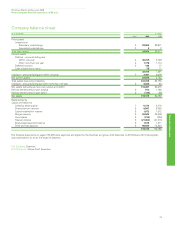
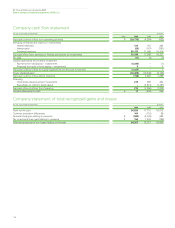
Parent company financial statements of BP p.l.c.
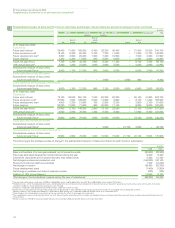
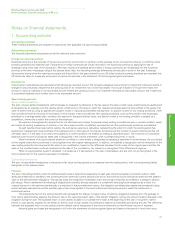
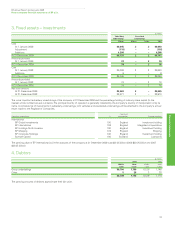
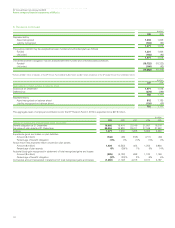
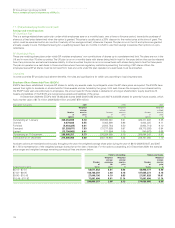
5. Creditors
47
$ million
2009 2008
Within After Within After
1 year 1 year 1 year 1 year
Group undertakings 2,343 4,236 2,581 –
Accruals and deferred income 27 74 7
Dividends 1–1 –
Other 30 18 20 33
2,401 4,328 2,609 80
The carrying amounts of creditors approximate their fair value.
The maturity profile of the financial liabilities included in the balance sheet at 31 December is shown in the table below. These amounts are
included within Creditors – amounts falling due after more than one year, and are denominated in US dollars.
Amounts falling due after one year include $4,236 million payable to a group undertaking. This amount is subject to interest payable quarterly at
LIBOR plus 55 basis points.
$ million
2009 2008
Due within
1 to 2 years 33 21
2 to 5 years 51 35
More than 5 years 4,244 24
4,328 80
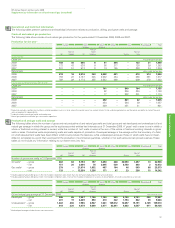
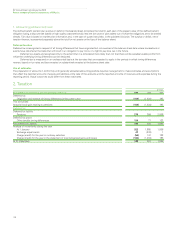
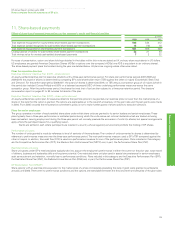
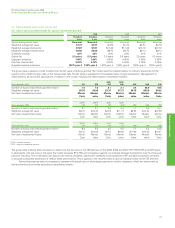
6. Pensions
200
The primary pension arrangement in the UK is a funded final salary pension plan under which retired employees draw the majority of their benefit as
an annuity. During 2009, BP announced that, with effect from 1 April 2010, it will close its UK plan to new joiners other than some of those joining the
North Sea SPU. The plan will remain open to those employees who joined BP on or before 31 March 2010.
The obligation and cost of providing the pension benefits is assessed annually using the projected unit credit method. The date of the most
recent actuarial review was 31 December 2009. The principal plans are subject to a formal actuarial valuation every three years in the UK. The most
recent formal actuarial valuation of the main UK pension plan was as at 31 December 2008.
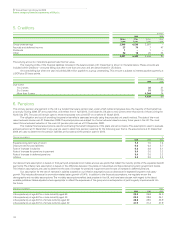
The material financial assumptions used for estimating the benefit obligations of the plans are set out below. The assumptions used to evaluate
accrued pension at 31 December in any year are used to determine pension expense for the following year, that is, the assumptions at 31 December
2009 are used to determine the pension liabilities at that date and the pension cost for 2010.
Financial assumptions %
2009 2008 2007
Expected long-term rate of return 7.4 7.5 7.4
Discount rate for plan liabilities 5.8 6.3 5.7
Rate of increase in salaries 5.3 4.9 5.1
Rate of increase for pensions in payment 3.4 3.0 3.2
Rate of increase in deferred pensions 3.4 3.0 3.2
Inflation 3.4 3.0 3.2
Our discount rate assumption is based on third-party AA corporate bond indices and we use yields that reflect the maturity profile of the expected benefit
payments. The inflation rate assumption is based on the difference between the yields on index-linked and fixed-interest long-term government bonds.
The inflation assumptions are used to determine the rate of increase for pensions in payment and the rate of increase in deferred pensions.
Our assumption for the rate of increase in salaries is based on our inflation assumption plus an allowance for expected long-term real salary
growth. This includes allowance for promotion-related salary growth of 0.4%. In addition to the financial assumptions, we regularly review the
demographic and mortality assumptions. The mortality assumptions reflect best practice in the UK, and have been chosen with regard to the latest
available published tables adjusted where appropriate to reflect the experience of the group and an extrapolation of past longevity improvements into
the future.
Mortality assumptions Ye a r s
2009 2008 2007
Life expectancy at age 60 for a male currently aged 60 26.0 25.9 24.0
Life expectancy at age 60 for a male currently aged 40 29.0 28.9 25.1
Life expectancy at age 60 for a female currently aged 60 28.6 28.5 26.9
Life expectancy at age 60 for a female currently aged 40 31.5 31.4 27.9