BP 2009 Annual Report Download - page 148
Download and view the complete annual report
Please find page 148 of the 2009 BP annual report below. You can navigate through the pages in the report by either clicking on the pages listed below, or by using the keyword search tool below to find specific information within the annual report.-
 1
1 -
2
-
3
-
4
-
5
-
6
-
7
-
8
-
9
-
10
-
11
-
12
-
13
-
14
-
15
-
16
-
17
-
18
-
19
-
20
-
21
-
22
-
23
-
24
-
25
-
26
-
27
-
28
-
29
-
30
-
31
-
32
-
33
-
34
-
35
-
36
-
37
-
38
-
39
-
40
-
41
-
42
-
43
-
44
-
45
-
46
-
47
-
48
-
49
-
50
-
51
-
52
-
53
-
54
-
55
-
56
-
57
-
58
-
59
-
60
-
61
-
62
-
63
-
64
-
65
-
66
-
67
-
68
-
69
-
70
-
71
-
72
-
73
-
74
-
75
-
76
-
77
-
78
-
79
-
80
-
81
-
82
-
83
-
84
-
85
-
86
-
87
-
88
-
89
-
90
-
91
-
92
-
93
-
94
-
95
-
96
-
97
-
98
-
99
-
100
-
101
-
102
-
103
-
104
-
105
-
106
-
107
-
108
-
109
-
110
-
111
-
112
-
113
-
114
-
115
-
116
-
117
-
118
-
119
-
120
-
121
-
122
-
123
-
124
-
125
-
126
-
127
-
128
-
129
-
130
-
131
-
132
-
133
-
134
-
135
-
136
-
137
-
 138
138 -
 139
139 -
 140
140 -
 141
141 -
 142
142 -
 143
143 -
 144
144 -
 145
145 -
 146
146 -
 147
147 -
 148
148 -
 149
149 -
 150
150 -
 151
151 -
 152
152 -
 153
153 -
 154
154 -
 155
155 -
 156
156 -
 157
157 -
 158
158 -
159
-
160
-
161
-
162
-
163
-
164
-
165
-
166
-
167
-
168
-
169
-
170
-
171
-
172
-
173
-
174
-
175
-
176
-
177
-
178
-
179
-
180
-
181
-
182
-
183
-
184
-
185
-
186
-
187
-
188
-
189
-
190
-
191
-
192
-
193
-
194
-
195
-
196
-
197
-
198
-
199
-
200
-
201
-
202
-
203
-
204
-
205
-
206
-
207
-
208
-
209
-
210
-
211
-
212
 |
 |

BP Annual Report and Accounts 2009
Notes on financial statements
24. Financial instruments and financial risk factors continued
146
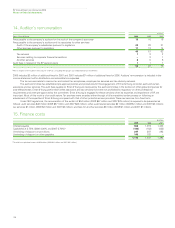
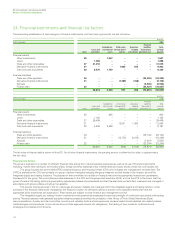
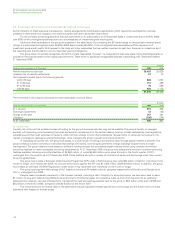
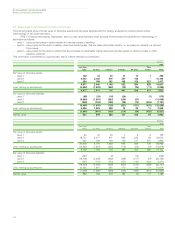
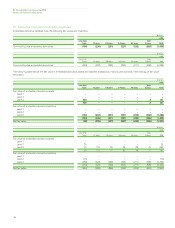
For these embedded derivatives the sensitivity of the net fair value to an immediate 10% favourable or adverse change in the key assumptions is as follows.
$ million
At 31 December 2009 2008
Discount Discount
Gas price Oil price Power price rate Gas price Oil price Power price rate
Favourable 10% change 175 26 23 20 291 81 27 16
Unfavourable 10% change (215) (43) (19) (20) (289) (81) (27) (16)
The sensitivities for risk management activity and embedded derivatives are hypothetical and should not be considered to be predictive of future
performance. In addition, for the purposes of this analysis, in the above table, the effect of a variation in a particular assumption on the fair value of the
embedded derivatives is calculated independently of any change in another assumption. In reality, changes in one factor may contribute to changes in
another, which may magnify or counteract the sensitivities. Furthermore, the estimated fair values as disclosed should not be considered indicative of
future earnings on these contracts.
(ii) Foreign currency exchange risk
Where the group enters into foreign currency exchange contracts for entrepreneurial trading purposes the activity is controlled using trading value-at-risk
techniques as explained above. This activity is described as currency trading in the value at risk table above.
Since BP has global operations, fluctuations in foreign currency exchange rates can have significant effects on the group’s reported results.
The effects of most exchange rate fluctuations are absorbed in business operating results through changing cost competitiveness, lags in market
adjustment to movements in rates and conversion differences accounted for on specific transactions. For this reason, the total effect of exchange
rate fluctuations is not identifiable separately in the group’s reported results. The main underlying economic currency of the group’s cash flows is
the US dollar. This is because BP’s major product, oil, is priced internationally in US dollars. BP’s foreign currency exchange management policy is
to minimize economic and material transactional exposures arising from currency movements against the US dollar. The group co-ordinates the
handling of foreign currency exchange risks centrally, by netting off naturally-occurring opposite exposures wherever possible, and then dealing
with any material residual foreign currency exchange risks.
The group manages these exposures by constantly reviewing the foreign currency economic value at risk and managing such risk to keep the
12-month foreign currency value at risk below $200 million. At 31 December 2009, the foreign currency value at risk was $140 million (2008
$70 million). At no point over the past three years did the value at risk exceed the maximum risk limit. The most significant exposures relate to capital
expenditure commitments and other UK and European operational requirements, for which a hedging programme is in place and hedge accounting is
claimed as outlined in Note 31.
For highly probable forecast capital expenditures the group locks in the US dollar cost of non-US dollar supplies by using currency
forwards and futures. The main exposures are sterling, Canadian dollar, euro, Norwegian krone, Australian dollar, Korean won, and at
31 December 2009 open contracts were in place for $800 million sterling, $491 million Canadian dollar, $299 million euro, $240 million
Norwegian krone, $215 million Australian dollar, $51 million Korean won and $41 million Singapore dollar capital expenditures maturing within
six years, with over 65% of the deals maturing within two years (2008 $949 million sterling, $712 million Canadian dollar, $553 million euro,
$392 million Norwegian krone, $303 million Australian dollar and $187 million Korean won capital expenditures maturing within seven years
with over 65% of the deals maturing within two years).
For other UK, European, Canadian and Australian operational requirements the group uses cylinders and currency forwards to hedge
the estimated exposures on a 12-month rolling basis. At 31 December 2009, the open positions relating to cylinders consisted of receive
sterling, pay US dollar, purchased call and sold put options (cylinders) for $1,887 million (2008 $1,660 million); receive euro, pay US dollar
cylinders for $1,716 million (2008 $1,612 million); receive Canadian dollar, pay US dollar cylinders for $300 million (2008 $250 million); and
receive Australian dollar, pay US dollar cylinders for $297 million (2008 $455 million). At 31 December 2009 there were no open positions
relating to currency forwards (2008 buy sterling, sell US dollar currency forwards for $816 million; buy euro, sell US dollar currency forwards
for $141 million; buy Canadian dollar, sell US dollar, currency forwards for $50 million; and buy Australian dollar, sell US dollar currency
forwards for $90 million).
In addition, most of the group’s borrowings are in US dollars or are hedged with respect to the US dollar. At 31 December 2009, the total
foreign currency net borrowings not swapped into US dollars amounted to $465 million (2008 $1,037 million). Of this total, $113 million was
denominated in currencies other than the functional currency of the individual operating unit being entirely Canadian dollars (2008 $92 million, being
entirely Canadian dollars). It is estimated that a 10% change in the corresponding exchange rates would result in an exchange gain or loss in the
income statement of $11 million (2008 $9 million).
(iii) Interest rate risk
Where the group enters into money market contracts for entrepreneurial trading purposes the activity is controlled using value-at-risk techniques as
described above. This activity is described as interest rate trading in the value-at-risk table above.
BP is also exposed to interest rate risk from the possibility that changes in interest rates will affect future cash flows or the fair values of its
financial instruments, principally finance debt.
While the group issues debt in a variety of currencies based on market opportunities, it uses derivatives to swap the debt to a US dollar
floating rate exposure but in certain defined circumstances maintains a fixed rate exposure for a proportion of debt. The proportion of floating
rate debt net of interest rate swaps at 31 December 2009 was 63% of total finance debt outstanding (2008 72%). The weighted average
interest rate on finance debt at 31 December 2009 is 2% (2008 3%) and the weighted average maturity of fixed rate debt is four years
(2008 three years).