BP 2009 Annual Report Download - page 181
Download and view the complete annual report
Please find page 181 of the 2009 BP annual report below. You can navigate through the pages in the report by either clicking on the pages listed below, or by using the keyword search tool below to find specific information within the annual report.-
 1
1 -
2
-
3
-
4
-
5
-
6
-
7
-
8
-
9
-
10
-
11
-
12
-
13
-
14
-
15
-
16
-
17
-
18
-
19
-
20
-
21
-
22
-
23
-
24
-
25
-
26
-
27
-
28
-
29
-
30
-
31
-
32
-
33
-
34
-
35
-
36
-
37
-
38
-
39
-
40
-
41
-
42
-
43
-
44
-
45
-
46
-
47
-
48
-
49
-
50
-
51
-
52
-
53
-
54
-
55
-
56
-
57
-
58
-
59
-
60
-
61
-
62
-
63
-
64
-
65
-
66
-
67
-
68
-
69
-
70
-
71
-
72
-
73
-
74
-
75
-
76
-
77
-
78
-
79
-
80
-
81
-
82
-
83
-
84
-
85
-
86
-
87
-
88
-
89
-
90
-
91
-
92
-
93
-
94
-
95
-
96
-
97
-
98
-
99
-
100
-
101
-
102
-
103
-
104
-
105
-
106
-
107
-
108
-
109
-
110
-
111
-
112
-
113
-
114
-
115
-
116
-
117
-
118
-
119
-
120
-
121
-
122
-
123
-
124
-
125
-
126
-
127
-
128
-
129
-
130
-
131
-
132
-
133
-
134
-
135
-
136
-
137
-
138
-
139
-
140
-
141
-
142
-
143
-
144
-
145
-
146
-
147
-
148
-
149
-
150
-
151
-
152
-
153
-
154
-
155
-
156
-
157
-
158
-
159
-
160
-
161
-
162
-
163
-
164
-
165
-
166
-
167
-
168
-
169
-
170
-
 171
171 -
 172
172 -
 173
173 -
 174
174 -
 175
175 -
 176
176 -
 177
177 -
 178
178 -
 179
179 -
 180
180 -
 181
181 -
 182
182 -
 183
183 -
 184
184 -
 185
185 -
 186
186 -
 187
187 -
 188
188 -
 189
189 -
 190
190 -
 191
191 -
192
-
193
-
194
-
195
-
196
-
197
-
198
-
199
-
200
-
201
-
202
-
203
-
204
-
205
-
206
-
207
-
208
-
209
-
210
-
211
-
212
 |
 |

BP Annual Report and Accounts 2009
Supplementary information on oil and natural gas (unaudited)
Financial statements
Supplementary information on oil and natural gas (unaudited)
179
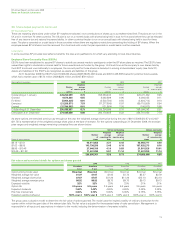
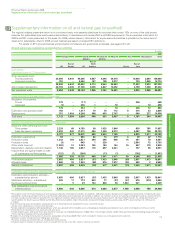
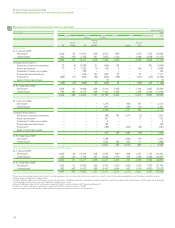
The regional analysis presented below is on a continent basis, with separate disclosure for countries that contain 15% or more of the total proved
reserves (for subsidiaries plus equity-accounted entities), in accordance with revised SEC and FASB requirements. The comparative information for
2008 and 2007 is also presented on this basis. For 2009, where relevant, information for equity-accounted entities is provided in the same level of
detail as for subsidiaries. Also for 2009, proved reserves are based on revised SEC definitions.
For details on BP’s proved reserves and production compliance and governance processes, see pages 24 to 26.
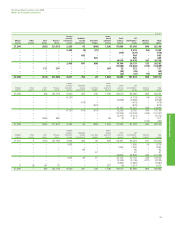
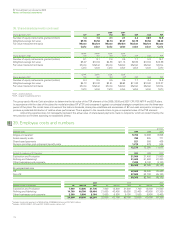
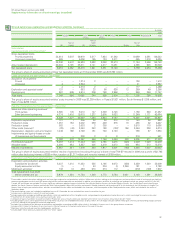
Oil and natural gas exploration and production activities
$ million
2009
Europe North South Africa Asia Australasia Total
America America
Rest of
Rest of North Rest of
UK Europe US America Russia Asia
Subsidiariesa
Capitalized costs at 31 Decemberb
Gross capitalized costs
Proved properties 35,096 6,644 64,366 3,967 8,346 24,476 – 10,900 2,894 156,689
Unproved properties 752 – 5,464 147 198 2,377 – 733 1,039 10,710
35,848 6,644 69,830 4,114 8,544 26,853 – 11,633 3,933 167,399
Accumulated depreciation 26,794 3,306 31,728 2,309 4,837 12,492 – 4,798 1,038 87,302
Net capitalized costs 9,054 3,338 38,102 1,805 3,707 14,361 – 6,835 2,895 80,097
Costs incurred for the year ended 31 Decemberb
Acquisition of propertiesc
Proved 179 – (17) ––––306 – 468
Unproved (1) – 370 1 – 18 – – 10 398
178 – 353 1 – 18 – 306 10 866
Exploration and appraisal costsd183 – 1,377 79 78 712 8 315 53 2,805
Development 751 1,054 4,208 386 453 2,707 – 560 277 10,396
Total costs 1,112 1,054 5,938 466 531 3,437 8 1,181 340 14,067
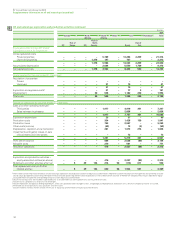
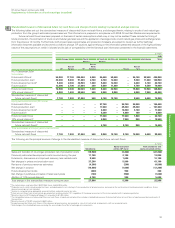
Results of operations for the year ended 31 December
Sales and other operating revenuese
Third parties 2,239 68 4,759 99 1,525 1,846 – 636 785 11,957
Sales between businesses 2,482 809 11,313 484 1,409 5,313 – 6,257 726 28,793
4,721 877 16,072 583 2,934 7,159 – 6,893 1,511 40,750
Exploration expenditure 59 – 663 80 16 219 8 49 22 1,116
Production costs 1,243 164 2,821 284 395 908 15 361 70 6,261
Production taxes (3) – 649 1 220 – – 2,854 72 3,793
Other costs (income)f(1,259) 51 2,353 145 184 144 76 967 178 2,839
Depreciation, depletion and amortization 1,148 185 3,857 170 697 2,041 – 757 96 8,951
Impairments and (gains) losses on sale
of businesses and fixed assets (122) (7) (208) – (11) (1) – (702)j– (1,051)
1,066 393 10,135 680 1,501 3,311 99 4,286 438 21,909
Profit before taxationg3,655 484 5,937 (97) 1,433 3,848 (99) 2,607 1,073 18,841
Allocable taxes 1,568 76 1,902 (58) 916 1,517 (25) 682 2 6,580
Results of operations 2,087 408 4,035 (39) 517 2,331 (74) 1,925 1,071 12,261
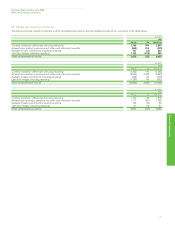
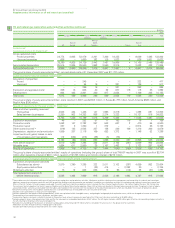
Exploration and Production segment replacement cost profit before interest and tax
Exploration and production activities –
subsidiaries (as above) 3,655 484 5,937 (97) 1,433 3,848 (99) 2,607 1,073 18,841
Midstream activities – subsidiariesh925 17 719 833 17 (27) (37) 518 (315) 2,650
Equity-accounted entitiesi– 5 29 134 630 56 1,924 531 – 3,309
Total replacement cost profit before
interest and tax 4,580 506 6,685 870 2,080 3,877 1,788 3,656 758 24,800
aThese tables contain information relating to oil and natural gas exploration and production activities of subsidiaries. Midstream activities relating to the management and ownership of crude oil and natural
gas pipelines, processing and export terminals and LNG processing facilities and transportation are excluded. In addition, our midstream activities of marketing and trading of natural gas, power and NGL’s
in the US, Canada, UK and Europe are excluded. The most significant midstream pipeline interests include the Trans-Alaska Pipeline System, the Forties Pipeline System, the Central Area Transmission
System pipeline, the South Caucasus Pipeline and the Baku-Tbilisi-Ceyhan pipeline. Major LNG activities are located in Trinidad, Indonesia and Australia and BP is also investing in the LNG business
in Angola.
bDecommissioning assets are included in capitalized costs at 31 December but are excluded from costs incurred for the year.
cIncludes costs capitalized as a result of asset exchanges.
dIncludes exploration and appraisal drilling expenditures, which are capitalized within intangible assets, and geological and geophysical exploration costs, which are charged to income as incurred.
ePresented net of transportation costs, purchases and sales taxes.
fIncludes property taxes, other government take and the fair value gain on embedded derivatives of $663 million. The UK region includes a $783 million gain offset by corresponding charges primarily in
the US, relating to the group self-insurance programme.
gExcludes the unwinding of the discount on provisions and payables amounting to $308 million which is included in finance costs in the group income statement.
hMidstream activities exclude inventory holding gains and losses.
iThe profits of equity-accounted entities are included after interest and tax.
jIncludes the gain on disposal of upstream assets associated with our sale of our 46% stake in LukArco (see Note 3).