BP 2009 Annual Report Download - page 154
Download and view the complete annual report
Please find page 154 of the 2009 BP annual report below. You can navigate through the pages in the report by either clicking on the pages listed below, or by using the keyword search tool below to find specific information within the annual report.-
 1
1 -
2
-
3
-
4
-
5
-
6
-
7
-
8
-
9
-
10
-
11
-
12
-
13
-
14
-
15
-
16
-
17
-
18
-
19
-
20
-
21
-
22
-
23
-
24
-
25
-
26
-
27
-
28
-
29
-
30
-
31
-
32
-
33
-
34
-
35
-
36
-
37
-
38
-
39
-
40
-
41
-
42
-
43
-
44
-
45
-
46
-
47
-
48
-
49
-
50
-
51
-
52
-
53
-
54
-
55
-
56
-
57
-
58
-
59
-
60
-
61
-
62
-
63
-
64
-
65
-
66
-
67
-
68
-
69
-
70
-
71
-
72
-
73
-
74
-
75
-
76
-
77
-
78
-
79
-
80
-
81
-
82
-
83
-
84
-
85
-
86
-
87
-
88
-
89
-
90
-
91
-
92
-
93
-
94
-
95
-
96
-
97
-
98
-
99
-
100
-
101
-
102
-
103
-
104
-
105
-
106
-
107
-
108
-
109
-
110
-
111
-
112
-
113
-
114
-
115
-
116
-
117
-
118
-
119
-
120
-
121
-
122
-
123
-
124
-
125
-
126
-
127
-
128
-
129
-
130
-
131
-
132
-
133
-
134
-
135
-
136
-
137
-
138
-
139
-
140
-
141
-
142
-
143
-
 144
144 -
 145
145 -
 146
146 -
 147
147 -
 148
148 -
 149
149 -
 150
150 -
 151
151 -
 152
152 -
 153
153 -
 154
154 -
 155
155 -
 156
156 -
 157
157 -
 158
158 -
 159
159 -
 160
160 -
 161
161 -
 162
162 -
 163
163 -
 164
164 -
165
-
166
-
167
-
168
-
169
-
170
-
171
-
172
-
173
-
174
-
175
-
176
-
177
-
178
-
179
-
180
-
181
-
182
-
183
-
184
-
185
-
186
-
187
-
188
-
189
-
190
-
191
-
192
-
193
-
194
-
195
-
196
-
197
-
198
-
199
-
200
-
201
-
202
-
203
-
204
-
205
-
206
-
207
-
208
-
209
-
210
-
211
-
212
 |
 |

BP Annual Report and Accounts 2009
Notes on financial statements
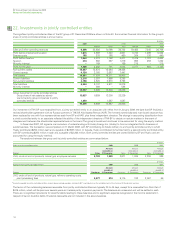
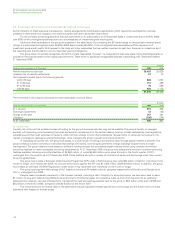
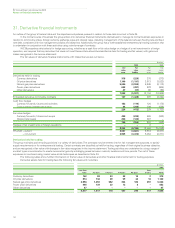
31. Derivative financial instruments
47
152
An outline of the group’s financial risks and the objectives and policies pursued in relation to those risks is set out in Note 24.
In the normal course of business the group enters into derivative financial instruments (derivatives) to manage its normal business exposures in
relation to commodity prices, foreign currency exchange rates and interest rates, including management of the balance between floating rate and fixed
rate debt, consistent with risk management policies and objectives. Additionally, the group has a well-established entrepreneurial trading operation that
is undertaken in conjunction with these activities using a similar range of contracts.
IAS 39 prescribes strict criteria for hedge accounting, whether as a cash flow or fair value hedge or a hedge of a net investment in a foreign
operation, and requires that any derivative that does not meet these criteria should be classified as held for trading and fair valued, with gains and
losses recognized in the income statement.
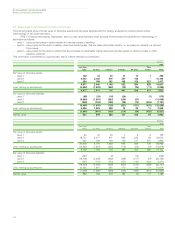
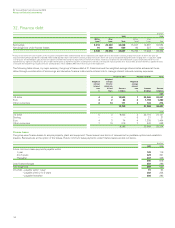
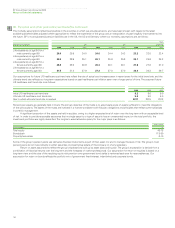
The fair values of derivative financial instruments at 31 December are set out below.
$ million
2009 2008
Fair Fair Fair Fair
value value value value
asset liability asset liability
Derivatives held for trading
Currency derivatives 318 (226) 278 (273)
Oil price derivatives 1,140 (1,191) 3,813 (3,523)
Natural gas price derivatives 5,636 (3,960) 6,945 (6,113)
Power price derivatives 682 (497) 978 (904)
Other derivatives 47 (47) 90 (96)
7,823 (5,921) 12,104 (10,909)
Embedded derivative commodity contracts 137 (1,468) 397 (2,264)
Cash flow hedges
Currency forwards, futures and cylinders 182 (114) 120 (1,175)
Cross-currency interest rate swaps 44 (298) 109 (558)
226 (412) 229 (1,733)
Fair value hedges
Currency forwards, futures and swaps 490 (232) 465 (342)
Interest rate swaps 256 (122) 367 –
746 (354) 832 (342)
Hedges of net investments in foreign operations ––2 –
8,932 (8,155) 13,564 (15,248)
Of which – current 4,967 (4,681) 8,510 (8,977)
– non-current 3,965 (3,474) 5,054 (6,271)
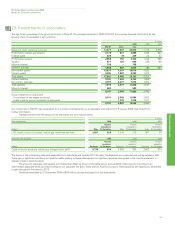
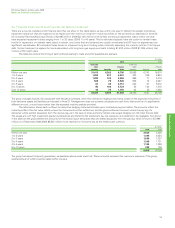
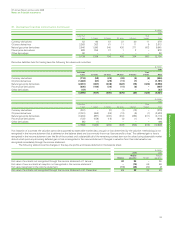
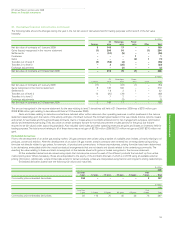
Derivatives held for trading
The group maintains active trading positions in a variety of derivatives. The contracts may be entered into for risk management purposes, to satisfy
supply requirements or for entrepreneurial trading. Certain contracts are classified as held for trading, regardless of their original business objective,
and are recognized at fair value with changes in fair value recognized in the income statement. Trading activities are undertaken by using a range of
contract types in combination to create incremental gains by arbitraging prices between markets, locations and time periods. The net of these
exposures is monitored using market value-at-risk techniques as described in Note 24.
The following tables show further information on the fair value of derivatives and other financial instruments held for trading purposes.
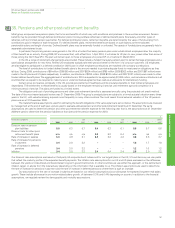
Derivative assets held for trading have the following fair values and maturities.
$ million
2009
Less than Over
1 year 1-2 years 2-3 years 3-4 years 4-5 years 5 years Total
Currency derivatives 162 83 33 22 16 2 318
Oil price derivatives 814 136 69 59 44 18 1,140
Natural gas price derivatives 2,958 1,059 582 354 186 497 5,636
Power price derivatives 496 139 32 12 3 – 682
Other derivatives 47 –––––
4,477 1,417 716 447 249 517 7,823