BP 2009 Annual Report Download - page 158
Download and view the complete annual report
Please find page 158 of the 2009 BP annual report below. You can navigate through the pages in the report by either clicking on the pages listed below, or by using the keyword search tool below to find specific information within the annual report.-
 1
1 -
2
-
3
-
4
-
5
-
6
-
7
-
8
-
9
-
10
-
11
-
12
-
13
-
14
-
15
-
16
-
17
-
18
-
19
-
20
-
21
-
22
-
23
-
24
-
25
-
26
-
27
-
28
-
29
-
30
-
31
-
32
-
33
-
34
-
35
-
36
-
37
-
38
-
39
-
40
-
41
-
42
-
43
-
44
-
45
-
46
-
47
-
48
-
49
-
50
-
51
-
52
-
53
-
54
-
55
-
56
-
57
-
58
-
59
-
60
-
61
-
62
-
63
-
64
-
65
-
66
-
67
-
68
-
69
-
70
-
71
-
72
-
73
-
74
-
75
-
76
-
77
-
78
-
79
-
80
-
81
-
82
-
83
-
84
-
85
-
86
-
87
-
88
-
89
-
90
-
91
-
92
-
93
-
94
-
95
-
96
-
97
-
98
-
99
-
100
-
101
-
102
-
103
-
104
-
105
-
106
-
107
-
108
-
109
-
110
-
111
-
112
-
113
-
114
-
115
-
116
-
117
-
118
-
119
-
120
-
121
-
122
-
123
-
124
-
125
-
126
-
127
-
128
-
129
-
130
-
131
-
132
-
133
-
134
-
135
-
136
-
137
-
138
-
139
-
140
-
141
-
142
-
143
-
144
-
145
-
146
-
147
-
 148
148 -
 149
149 -
 150
150 -
 151
151 -
 152
152 -
 153
153 -
 154
154 -
 155
155 -
 156
156 -
 157
157 -
 158
158 -
 159
159 -
 160
160 -
 161
161 -
 162
162 -
 163
163 -
 164
164 -
 165
165 -
 166
166 -
 167
167 -
 168
168 -
169
-
170
-
171
-
172
-
173
-
174
-
175
-
176
-
177
-
178
-
179
-
180
-
181
-
182
-
183
-
184
-
185
-
186
-
187
-
188
-
189
-
190
-
191
-
192
-
193
-
194
-
195
-
196
-
197
-
198
-
199
-
200
-
201
-
202
-
203
-
204
-
205
-
206
-
207
-
208
-
209
-
210
-
211
-
212
 |
 |

BP Annual Report and Accounts 2009
Notes on financial statements
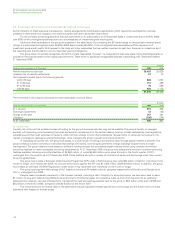
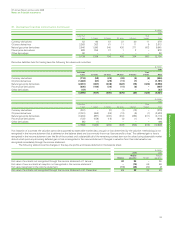
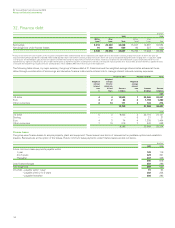
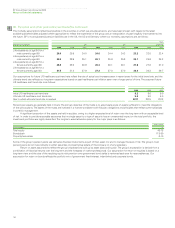
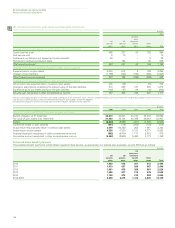
31. Derivative financial instruments continued
–
–
–
–
–
–
156
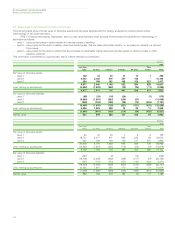
Embedded derivative liabilities have the following fair values and maturities.
$ million
2009
Less than Over
1 year 1-2 years 2-3 years 3-4 years 4-5 years 5 years Total
Commodity price embedded derivatives (154) (236) (231) (227) (232) (388) (1,468)
$ million
2008
Less than Over
1 year 1-2 years 2-3 years 3-4 years 4-5 years 5 years Total
Commodity price embedded derivatives (404) (322) (365) (303) (271) (599) (2,264)
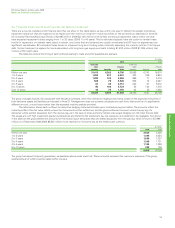
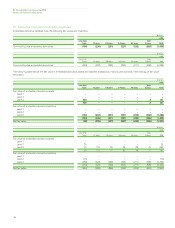
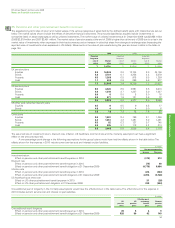
The following table shows the fair value of embedded derivative assets and liabilities analysed by maturity period and by methodology of fair value
estimation.
$ million
2009
Less than Over
1 year 1-2 years 2-3 years 3-4 years 4-5 years 5 years Total
Fair value of embedded derivative assets
Level 1 – –––––
Level 2 – –––––
Level 3 134 – – – – 3 137
134 – – – – 3 137
Fair value of embedded derivative liabilities
Level 1 – –––––
Level 2 – –––––
Level 3 (154) (236) (231) (227) (232) (388) (1,468)
(154) (236) (231) (227) (232) (388) (1,468)
Net fair value (20) (236) (231) (227) (232) (385) (1,331)
$ million
2008
Less than Over
1 year 1-2 years 2-3 years 3-4 years 4-5 years 5 years Total
Fair value of embedded derivative assets
Level 1 – –––––
Level 2 35 – – – – – 35
Level 3 15 116 75 45 36 75 362
50 116 75 45 36 75 397
Fair value of embedded derivative liabilities
Level 1 – –––––
Level 2 (10) – – – – – (10)
Level 3 (394) (322) (365) (303) (271) (599) (2,254)
(404) (322) (365) (303) (271) (599) (2,264)
Net fair value (354) (206) (290) (258) (235) (524) (1,867)