BP 2009 Annual Report Download - page 116
Download and view the complete annual report
Please find page 116 of the 2009 BP annual report below. You can navigate through the pages in the report by either clicking on the pages listed below, or by using the keyword search tool below to find specific information within the annual report.-
 1
1 -
2
-
3
-
4
-
5
-
6
-
7
-
8
-
9
-
10
-
11
-
12
-
13
-
14
-
15
-
16
-
17
-
18
-
19
-
20
-
21
-
22
-
23
-
24
-
25
-
26
-
27
-
28
-
29
-
30
-
31
-
32
-
33
-
34
-
35
-
36
-
37
-
38
-
39
-
40
-
41
-
42
-
43
-
44
-
45
-
46
-
47
-
48
-
49
-
50
-
51
-
52
-
53
-
54
-
55
-
56
-
57
-
58
-
59
-
60
-
61
-
62
-
63
-
64
-
65
-
66
-
67
-
68
-
69
-
70
-
71
-
72
-
73
-
74
-
75
-
76
-
77
-
78
-
79
-
80
-
81
-
82
-
83
-
84
-
85
-
86
-
87
-
88
-
89
-
90
-
91
-
92
-
93
-
94
-
95
-
96
-
97
-
98
-
99
-
100
-
101
-
102
-
103
-
104
-
105
-
 106
106 -
 107
107 -
 108
108 -
 109
109 -
 110
110 -
 111
111 -
 112
112 -
 113
113 -
 114
114 -
 115
115 -
 116
116 -
 117
117 -
 118
118 -
 119
119 -
 120
120 -
 121
121 -
 122
122 -
 123
123 -
 124
124 -
 125
125 -
 126
126 -
127
-
128
-
129
-
130
-
131
-
132
-
133
-
134
-
135
-
136
-
137
-
138
-
139
-
140
-
141
-
142
-
143
-
144
-
145
-
146
-
147
-
148
-
149
-
150
-
151
-
152
-
153
-
154
-
155
-
156
-
157
-
158
-
159
-
160
-
161
-
162
-
163
-
164
-
165
-
166
-
167
-
168
-
169
-
170
-
171
-
172
-
173
-
174
-
175
-
176
-
177
-
178
-
179
-
180
-
181
-
182
-
183
-
184
-
185
-
186
-
187
-
188
-
189
-
190
-
191
-
192
-
193
-
194
-
195
-
196
-
197
-
198
-
199
-
200
-
201
-
202
-
203
-
204
-
205
-
206
-
207
-
208
-
209
-
210
-
211
-
212
 |
 |

BP Annual Report and Accounts 2009
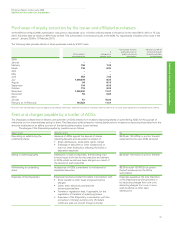
Consolidated financial statements of the BP group
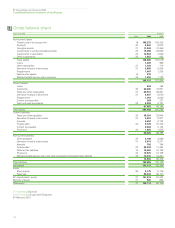
Group balance sheet
114
At 31 December $ million
Note 2009 2008
Non-current assets
Property, plant and equipment 19 108,275 103,200
Goodwill 20 8,620 9,878
Intangible assets 21 11,548 10,260
Investments in jointly controlled entities 22 15,296 23,826
Investments in associates 23 12,963 4,000
Other investments 25 1,567 855
Fixed assets 158,269 152,019
Loans 1,039 995
Other receivables 27 1,729 710
Derivative financial instruments 31 3,965 5,054
Prepayments 1,407 1,338
Deferred tax assets 16 516 –
Defined benefit pension plan surpluses 35 1,390 1,738
168,315 161,854
Current assets
Loans 249 168
Inventories 26 22,605 16,821
Trade and other receivables 27 29,531 29,261
Derivative financial instruments 31 4,967 8,510
Prepayments 1,753 3,050
Current tax receivable 209 377
Cash and cash equivalents 28 8,339 8,197
67,653 66,384
Total assets 235,968 228,238
Current liabilities
Trade and other payables 30 35,204 33,644
Derivative financial instruments 31 4,681 8,977
Accruals 6,202 6,743
Finance debt 32 9,109 15,740
Current tax payable 2,464 3,144
Provisions 34 1,660 1,545
59,320 69,793
Non-current liabilities
Other payables 30 3,198 3,080
Derivative financial instruments 31 3,474 6,271
Accruals 703 784
Finance debt 32 25,518 17,464
Deferred tax liabilities 16 18,662 16,198
Provisions 34 12,970 12,108
Defined benefit pension plan and other post-retirement benefit plan deficits 35 10,010 10,431
74,535 66,336
Total liabilities 133,855 136,129
Net assets 102,113 92,109
Equity
Share capital 36 5,179 5,176
Reserves 96,434 86,127
BP shareholders’ equity 37 101,613 91,303
Minority interest 37 500 806
Total equity 37 102,113 92,109
C-H Svanberg Chairman
Dr A B Hayward Group Chief Executive
26 February 2010