BP 2009 Annual Report Download - page 185
Download and view the complete annual report
Please find page 185 of the 2009 BP annual report below. You can navigate through the pages in the report by either clicking on the pages listed below, or by using the keyword search tool below to find specific information within the annual report.-
 1
1 -
2
-
3
-
4
-
5
-
6
-
7
-
8
-
9
-
10
-
11
-
12
-
13
-
14
-
15
-
16
-
17
-
18
-
19
-
20
-
21
-
22
-
23
-
24
-
25
-
26
-
27
-
28
-
29
-
30
-
31
-
32
-
33
-
34
-
35
-
36
-
37
-
38
-
39
-
40
-
41
-
42
-
43
-
44
-
45
-
46
-
47
-
48
-
49
-
50
-
51
-
52
-
53
-
54
-
55
-
56
-
57
-
58
-
59
-
60
-
61
-
62
-
63
-
64
-
65
-
66
-
67
-
68
-
69
-
70
-
71
-
72
-
73
-
74
-
75
-
76
-
77
-
78
-
79
-
80
-
81
-
82
-
83
-
84
-
85
-
86
-
87
-
88
-
89
-
90
-
91
-
92
-
93
-
94
-
95
-
96
-
97
-
98
-
99
-
100
-
101
-
102
-
103
-
104
-
105
-
106
-
107
-
108
-
109
-
110
-
111
-
112
-
113
-
114
-
115
-
116
-
117
-
118
-
119
-
120
-
121
-
122
-
123
-
124
-
125
-
126
-
127
-
128
-
129
-
130
-
131
-
132
-
133
-
134
-
135
-
136
-
137
-
138
-
139
-
140
-
141
-
142
-
143
-
144
-
145
-
146
-
147
-
148
-
149
-
150
-
151
-
152
-
153
-
154
-
155
-
156
-
157
-
158
-
159
-
160
-
161
-
162
-
163
-
164
-
165
-
166
-
167
-
168
-
169
-
170
-
171
-
172
-
173
-
174
-
 175
175 -
 176
176 -
 177
177 -
 178
178 -
 179
179 -
 180
180 -
 181
181 -
 182
182 -
 183
183 -
 184
184 -
 185
185 -
 186
186 -
 187
187 -
 188
188 -
 189
189 -
 190
190 -
 191
191 -
 192
192 -
 193
193 -
 194
194 -
 195
195 -
196
-
197
-
198
-
199
-
200
-
201
-
202
-
203
-
204
-
205
-
206
-
207
-
208
-
209
-
210
-
211
-
212
 |
 |

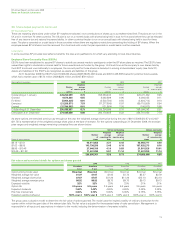
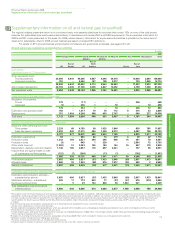
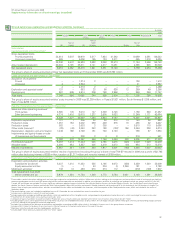
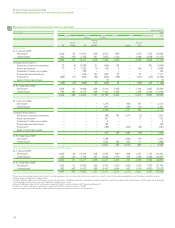
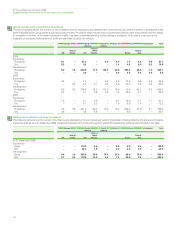
Movements in estimated net proved reserves
2
58
–
90
183
BP Annual Report and Accounts 2009
Supplementary information on oil and natural gas (unaudited)
Financial statements
million barrels
Crude oila2009
Europe North South Africa Asia Australasia Total
America America
Rest of
Rest of North Rest of
UK Europe USeAmerica Russia Asia
Subsidiaries
At 1 January 2009
Developed 410 81 1,717 11 47 464 – 195 56 2,981
Undeveloped 119 194 1,273 1 55 496 – 488 58 2,684
529 275 2,990 12 102 960 – 683 114 5,665
Changes attributable to
Revisions of previous estimates 7 (1) 165 2 18 (121) – (128) 3 (55)
Improved recovery 42 7 82 – 7 32 – 31 2 203
Purchases of reserves-in-place 1 ––––––1 –
Discoveries and extensions 184 – 73 – – 114 – – 7 378
Productionb(61) (14) (237) (2) (22) (109) – (45) (11) (501)
Sales of reserves-in-place (8)––––––(26) – (34)
165 (8) 83 – 3 (84) – (167) 1 (7)
At 31 December 2009c
Developed 403 83 1,862 11 49 422 – 182 58 3,070
Undeveloped 291 184 1,211 1 56 454 – 334 57 2,588
694 267 3,073 12 105 876 – 516 115 5,658
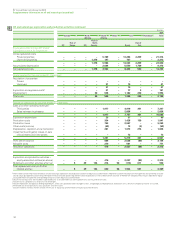
Equity-accounted entities (BP share)f
At 1 January 2009
Developed ––––399 – 2,227 499 – 3,125
Undeveloped ––––409 11 944 199 – 1,563
––––808 11 3,171 698 – 4,688
Changes attributable to
Revisions of previous estimates ––––2 (2)590 (28) – 562
Improved recovery ––––50 –8 ––
Purchases of reserves-in-place –––––––––
Discoveries and extensions ––––3 –87 ––
Production ––––(37) – (307) (71) – (415)
Sales of reserves-in-place ––––(14) – – (116) – (130)
––––4 (2)378 (215) – 165
At 31 December 2009d
Developed ––––407 – 2,351 363 – 3,121
Undeveloped ––––405 9 1,198 120 – 1,732
––––812 9 3,549 483 – 4,853
Total subsidiaries and equity-accounted entities (BP share)
At 1 January 2009
Developed 410 81 1,717 11 446 464 2,227 694 56 6,106
Undeveloped 119 194 1,273 1 464 507 944 687 58 4,247
529 275 2,990 12 910 971 3,171 1,381 114 10,353
At 31 December 2009
Developed 403 83 1,862 11 456 422 2,351 545 58 6,191
Undeveloped 291 184 1,211 1 461 463 1,198 454 57 4,320
694 267 3,073 12 917 885 3,549 999 115 10,511
aCrude oil includes NGLs and condensate. Proved reserves exclude royalties due to others, whether payable in cash or in kind, where the royalty owner has a direct interest in the underlying
production and the option and ability to make lifting and sales arrangements independently.
bExcludes NGLs from processing plants in which an interest is held of 26 thousand barrels a day.
cIncludes 819 million barrels of NGLs. Also includes 23 million barrels of crude oil in respect of the 30% minority interest in BP Trinidad and Tobago LLC.
dIncludes 20 million barrels of NGLs. Also includes 243 million barrels of crude oil in respect of the 6.86% minority interest in TNK-BP.
eProved reserves in the Prudhoe Bay field in Alaska include an estimated 68 million barrels upon which a net profits royalty will be payable over the life of the field under the terms of the BP Prudhoe
Bay Royalty Trust.
fVolumes of equity-accounted entities include volumes of equity-accounted investments of those entities.