BP 2009 Annual Report Download - page 152
Download and view the complete annual report
Please find page 152 of the 2009 BP annual report below. You can navigate through the pages in the report by either clicking on the pages listed below, or by using the keyword search tool below to find specific information within the annual report.-
 1
1 -
2
-
3
-
4
-
5
-
6
-
7
-
8
-
9
-
10
-
11
-
12
-
13
-
14
-
15
-
16
-
17
-
18
-
19
-
20
-
21
-
22
-
23
-
24
-
25
-
26
-
27
-
28
-
29
-
30
-
31
-
32
-
33
-
34
-
35
-
36
-
37
-
38
-
39
-
40
-
41
-
42
-
43
-
44
-
45
-
46
-
47
-
48
-
49
-
50
-
51
-
52
-
53
-
54
-
55
-
56
-
57
-
58
-
59
-
60
-
61
-
62
-
63
-
64
-
65
-
66
-
67
-
68
-
69
-
70
-
71
-
72
-
73
-
74
-
75
-
76
-
77
-
78
-
79
-
80
-
81
-
82
-
83
-
84
-
85
-
86
-
87
-
88
-
89
-
90
-
91
-
92
-
93
-
94
-
95
-
96
-
97
-
98
-
99
-
100
-
101
-
102
-
103
-
104
-
105
-
106
-
107
-
108
-
109
-
110
-
111
-
112
-
113
-
114
-
115
-
116
-
117
-
118
-
119
-
120
-
121
-
122
-
123
-
124
-
125
-
126
-
127
-
128
-
129
-
130
-
131
-
132
-
133
-
134
-
135
-
136
-
137
-
138
-
139
-
140
-
141
-
 142
142 -
 143
143 -
 144
144 -
 145
145 -
 146
146 -
 147
147 -
 148
148 -
 149
149 -
 150
150 -
 151
151 -
 152
152 -
 153
153 -
 154
154 -
 155
155 -
 156
156 -
 157
157 -
 158
158 -
 159
159 -
 160
160 -
 161
161 -
 162
162 -
163
-
164
-
165
-
166
-
167
-
168
-
169
-
170
-
171
-
172
-
173
-
174
-
175
-
176
-
177
-
178
-
179
-
180
-
181
-
182
-
183
-
184
-
185
-
186
-
187
-
188
-
189
-
190
-
191
-
192
-
193
-
194
-
195
-
196
-
197
-
198
-
199
-
200
-
201
-
202
-
203
-
204
-
205
-
206
-
207
-
208
-
209
-
210
-
211
-
212
 |
 |

BP Annual Report and Accounts 2009
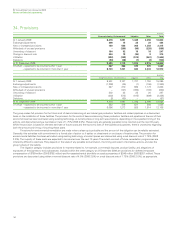
Notes on financial statements
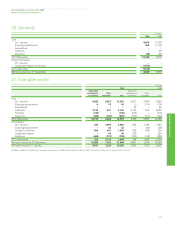
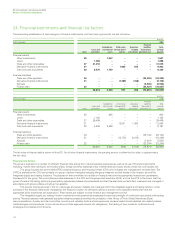
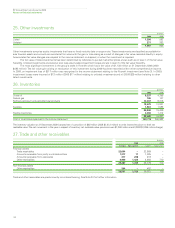
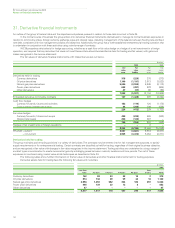
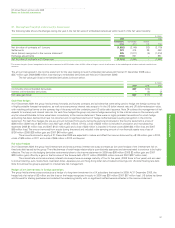
25. Other investments
$ million
2009 2008
Listed 1,296 592
Unlisted 271 263
1,567 855
Other investments comprise equity investments that have no fixed maturity date or coupon rate. These investments are classified as available-for-
sale financial assets and as such are recorded at fair value with the gain or loss arising as a result of changes in fair value recorded directly in equity.
Accumulated fair value changes are recycled to the income statement on disposal, or when the investment is impaired.
The fair value of listed investments has been determined by reference to quoted market bid prices and as such are in level 1 of the fair value
hierarchy. Unlisted investments are stated at cost less accumulated impairment losses and are in level 3 of the fair value hierarchy.
The most significant investment is the group’s stake in Rosneft which had a fair value of $1,138 million at 31 December 2009 (2008
$483 million). The fair value gain arising on revaluation of this investment during 2009 has been recorded within other comprehensive income.
In 2008, an impairment loss of $517 million was recognized in the income statement relating to the Rosneft investment (see Note 3). In 2009,
impairment losses were incurred of $13 million (2008 $17 million) relating to unlisted investments and nil (2008 $29 million) relating to other
listed investments.
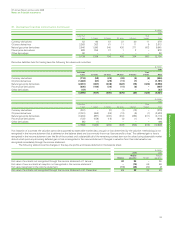
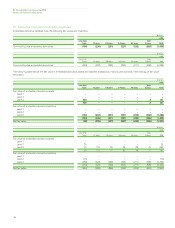
26. Inventories
150
$ million
2009 2008
Crude oil 6,237 4,396
Natural gas 105 107
Refined petroleum and petrochemical products 12,337 9,318
18,679 13,821
Supplies 1,661 1,588
20,340 15,409
Trading inventories 2,265 1,412
22,605 16,821
Cost of inventories expensed in the income statement 163,772 266,982
The inventory valuation at 31 December 2009 is stated net of a provision of $46 million (2008 $1,412 million) to write inventories down to their net
realizable value. The net movement in the year in respect of inventory net realizable value provisions was $1,366 million credit (2008 $1,295 million charge).
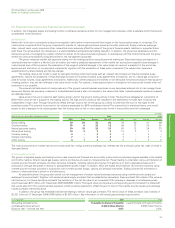
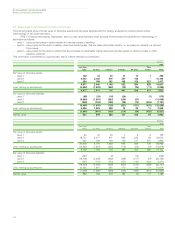
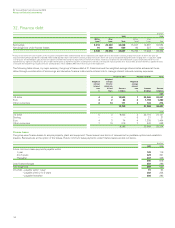
27. Trade and other receivables
$ million
2009 2008
Current Non-current Current Non-current
Financial assets
Trade receivables 22,604 – 22,869 –
Amounts receivable from jointly controlled entities 1,317 11 1,035 –
Amounts receivable from associates 417 298 219 –
Other receivables 4,949 1,420 4,656 710
29,287 1,729 28,779 710
Non-financial assets
Other receivables 244 – 482 –
29,531 1,729 29,261 710
Trade and other receivables are predominantly non-interest bearing. See Note 24 for further information.