BP 2009 Annual Report Download - page 183
Download and view the complete annual report
Please find page 183 of the 2009 BP annual report below. You can navigate through the pages in the report by either clicking on the pages listed below, or by using the keyword search tool below to find specific information within the annual report.-
 1
1 -
2
-
3
-
4
-
5
-
6
-
7
-
8
-
9
-
10
-
11
-
12
-
13
-
14
-
15
-
16
-
17
-
18
-
19
-
20
-
21
-
22
-
23
-
24
-
25
-
26
-
27
-
28
-
29
-
30
-
31
-
32
-
33
-
34
-
35
-
36
-
37
-
38
-
39
-
40
-
41
-
42
-
43
-
44
-
45
-
46
-
47
-
48
-
49
-
50
-
51
-
52
-
53
-
54
-
55
-
56
-
57
-
58
-
59
-
60
-
61
-
62
-
63
-
64
-
65
-
66
-
67
-
68
-
69
-
70
-
71
-
72
-
73
-
74
-
75
-
76
-
77
-
78
-
79
-
80
-
81
-
82
-
83
-
84
-
85
-
86
-
87
-
88
-
89
-
90
-
91
-
92
-
93
-
94
-
95
-
96
-
97
-
98
-
99
-
100
-
101
-
102
-
103
-
104
-
105
-
106
-
107
-
108
-
109
-
110
-
111
-
112
-
113
-
114
-
115
-
116
-
117
-
118
-
119
-
120
-
121
-
122
-
123
-
124
-
125
-
126
-
127
-
128
-
129
-
130
-
131
-
132
-
133
-
134
-
135
-
136
-
137
-
138
-
139
-
140
-
141
-
142
-
143
-
144
-
145
-
146
-
147
-
148
-
149
-
150
-
151
-
152
-
153
-
154
-
155
-
156
-
157
-
158
-
159
-
160
-
161
-
162
-
163
-
164
-
165
-
166
-
167
-
168
-
169
-
170
-
171
-
172
-
 173
173 -
 174
174 -
 175
175 -
 176
176 -
 177
177 -
 178
178 -
 179
179 -
 180
180 -
 181
181 -
 182
182 -
 183
183 -
 184
184 -
 185
185 -
 186
186 -
 187
187 -
 188
188 -
 189
189 -
 190
190 -
 191
191 -
 192
192 -
 193
193 -
194
-
195
-
196
-
197
-
198
-
199
-
200
-
201
-
202
-
203
-
204
-
205
-
206
-
207
-
208
-
209
-
210
-
211
-
212
 |
 |

Financial statements
Oil and natural gas exploration and production activities continued
d
e
g
h
k
BP Annual Report and Accounts 2009
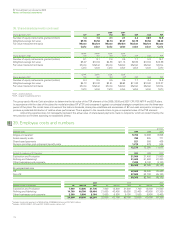
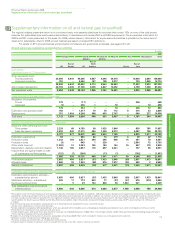
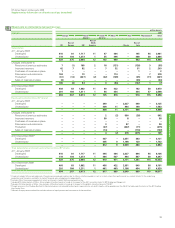
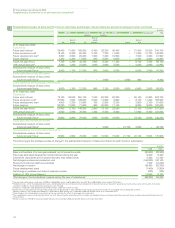
Supplementary information on oil and natural gas (unaudited)
181
$ million
2008
Europe North South Africa Asia Australasia Total
America America
Rest of
Rest of North Rest of
UK Europe US America Russia Asia
Subsidiariesa
Capitalized costs at 31 Decemberb
Gross capitalized costs
Proved properties 34,614 5,507 59,918 3,517 7,934 21,563 – 10,689 2,581 146,323
Unproved properties 626 – 5,006 165 134 2,011 – 465 1,018 9,425
35,240 5,507 64,924 3,682 8,068 23,574 – 11,154 3,599 155,748
Accumulated depreciation 26,564 3,125 28,511 2,141 4,217 10,451 – 4,395 945 80,349
Net capitalized costs 8,676 2,382 36,413 1,541 3,851 13,123 – 6,759 2,654 75,399
The group’s share of equity-accounted entities’ net capitalized costs at 31 December 2008 was $13,393 million.
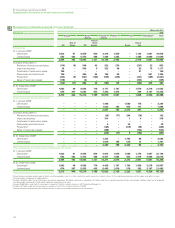
Costs incurred for the year ended 31 Decemberb
Acquisition of propertiesc
Proved – – 1,374 2 – – – 136 – 1,512
Unproved 4 – 2,942 ––––41 –2,987
4 – 4,316 2 – – – 177 – 4,499
Exploration and appraisal costsd137 – 862 33 90 838 12 269 49 2,290
Development 907 695 4,914 309 768 2,966 – 859 349 11,767
Total costs 1,048 695 10,092 344 858 3,804 12 1,305 398 18,556
The group’s share of equity-accounted entities’ costs incurred in 2008 was $3,259 million: in Russia $1,921 million, South America $1,039 million, and
Rest of Asia $299 million.
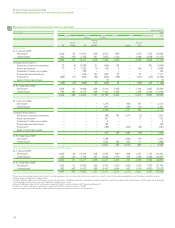
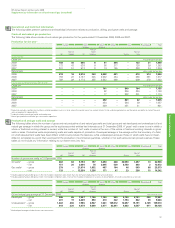
Results of operations for the year ended 31 December
Sales and other operating revenuese
Third parties 3,865 105 8,010 147 3,339 3,745 – 1,186 860 21,257
Sales between businesses 4,374 1,416 15,610 1,237 2,605 6,022 – 11,249 1,171 43,684
8,239 1,521 23,620 1,384 5,944 9,767 – 12,435 2,031 64,941
Exploration expenditure 121 1 305 32 30 213 14 140 26 882
Production costs 1,357 150 3,002 289 429 875 18 485 62 6,667
Production taxesf503 – 2,603 2 358 – – 5,510 110 9,086
Other costs (income)fg (28) (43) 3,440 343 198 (122)k196 2,064 226 6,274
Depreciation, depletion and amortization 1,049 199 2,729 181 730 2,120 – 788 87 7,883
Impairments and (gains) losses on sale
of businesses and fixed assets – – 308 2 4 8 – 219 – 541
3,002 307 12,387 849 1,749 3,094 228 9,206 511 31,333
Profit before taxationh5,237 1,214 11,233 535 4,195 6,673 (228) 3,229 1,520 33,608
Allocable taxes 2,280 883 3,857 205 2,218 2,672 (36) 984 513 13,576
Results of operations 2,957 331 7,376 330 1,977 4,001 (192) 2,245 1,007 20,032
The group’s share of equity-accounted entities’ results of operations (including the group’s share of total TNK-BP results) in 2008 was a profit of $2,793
million after deducting interest of $355 million, taxation of $1,217 million and minority interest of $169 million.
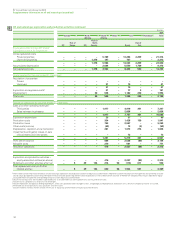
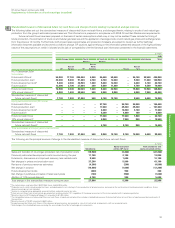
Exploration and Production segment replacement cost profit before interest and tax
Exploration and production activities
Subsidiaries (as above) 5,237 1,214 11,233 535 4,195 6,673 (228) 3,229 1,520 33,608
Equity-accounted entities (1) – 1 40 304 (1) 2,259 191 – 2,793
Midstream activitiesi j 743 16 490 673 274 112 – (272) (129) 1,907
Total replacement cost profit
before interest and tax 5,979 1,230 11,724 1,248 4,773 6,784 2,031 3,148 1,391 38,308
aThese tables contain information relating to oil and natural gas exploration and production activities. Midstream activities relating to the management and ownership of crude oil and natural gas pipelines,
processing and export terminals and LNG processing facilities and transportation are excluded. In addition, our midstream activities of marketing and trading of natural gas, power and NGLs in the US,
Canada, UK and Europe are excluded. The most significant midstream pipeline interests include the Trans-Alaska Pipeline System, the Forties Pipeline System, the Central Area Transmission System
pipeline, the South Caucasus Pipeline and the Baku-Tbilisi-Ceyhan pipeline. Major LNG activities are located in Trinidad, Indonesia and Australia and BP is also investing in the LNG business in Angola. The
group’s share of equity-accounted entities’ activities are excluded from the tables and included in the footnotes, with the exception of Abu Dhabi production taxes, which are included in the results of
operations above.
bDecommissioning assets are included in capitalized costs at 31 December but are excluded from costs incurred for the year.
cIncludes costs capitalized as a result of asset exchanges.
Includes exploration and appraisal drilling expenditures, which are capitalized within intangible assets, and geological and geophysical exploration costs, which are charged to income as incurred.
Presented net of transportation costs, purchases and sales taxes.
fComparative figures have been restated to include in Production taxes amounts previously reported within Other costs (income) amounting to $2,427 million.
Includes property taxes, other government take and the fair value loss on embedded derivatives of $102 million. The UK region includes a $499 million gain offset by corresponding charges primarily
in the US, relating to the group self-insurance programme.
Excludes the unwinding of the discount on provisions and payables amounting to $285 million which is included in finance costs in the group income statement.
iIncludes a $517 million write-down of our investment in Rosneft based on its quoted market price at the end of the year.
jMidstream activities exclude inventory holding gains and losses.
Includes $367 million previously reported within the ‘Other’ region.