BP 2009 Annual Report Download - page 150
Download and view the complete annual report
Please find page 150 of the 2009 BP annual report below. You can navigate through the pages in the report by either clicking on the pages listed below, or by using the keyword search tool below to find specific information within the annual report.-
 1
1 -
2
-
3
-
4
-
5
-
6
-
7
-
8
-
9
-
10
-
11
-
12
-
13
-
14
-
15
-
16
-
17
-
18
-
19
-
20
-
21
-
22
-
23
-
24
-
25
-
26
-
27
-
28
-
29
-
30
-
31
-
32
-
33
-
34
-
35
-
36
-
37
-
38
-
39
-
40
-
41
-
42
-
43
-
44
-
45
-
46
-
47
-
48
-
49
-
50
-
51
-
52
-
53
-
54
-
55
-
56
-
57
-
58
-
59
-
60
-
61
-
62
-
63
-
64
-
65
-
66
-
67
-
68
-
69
-
70
-
71
-
72
-
73
-
74
-
75
-
76
-
77
-
78
-
79
-
80
-
81
-
82
-
83
-
84
-
85
-
86
-
87
-
88
-
89
-
90
-
91
-
92
-
93
-
94
-
95
-
96
-
97
-
98
-
99
-
100
-
101
-
102
-
103
-
104
-
105
-
106
-
107
-
108
-
109
-
110
-
111
-
112
-
113
-
114
-
115
-
116
-
117
-
118
-
119
-
120
-
121
-
122
-
123
-
124
-
125
-
126
-
127
-
128
-
129
-
130
-
131
-
132
-
133
-
134
-
135
-
136
-
137
-
138
-
139
-
 140
140 -
 141
141 -
 142
142 -
 143
143 -
 144
144 -
 145
145 -
 146
146 -
 147
147 -
 148
148 -
 149
149 -
 150
150 -
 151
151 -
 152
152 -
 153
153 -
 154
154 -
 155
155 -
 156
156 -
 157
157 -
 158
158 -
 159
159 -
 160
160 -
161
-
162
-
163
-
164
-
165
-
166
-
167
-
168
-
169
-
170
-
171
-
172
-
173
-
174
-
175
-
176
-
177
-
178
-
179
-
180
-
181
-
182
-
183
-
184
-
185
-
186
-
187
-
188
-
189
-
190
-
191
-
192
-
193
-
194
-
195
-
196
-
197
-
198
-
199
-
200
-
201
-
202
-
203
-
204
-
205
-
206
-
207
-
208
-
209
-
210
-
211
-
212
 |
 |

BP Annual Report and Accounts 2009
Notes on financial statements
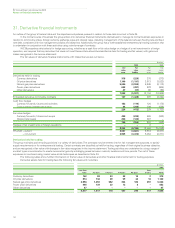
24. Financial instruments and financial risk factors continued
148
Some mitigation of credit exposure is achieved by: netting arrangements; credit support agreements which require the counterparty to provide
collateral or other credit risk mitigation; and credit insurance and other risk transfer instruments.
For the contracts comprising derivative financial instruments in an asset position at 31 December 2009, it is estimated that over 80% (2008
over 80%) of the unmitigated credit exposure is to counterparties of investment grade credit quality.
Trade and other receivables of the group are analysed in the table below. By comparing the BP credit ratings to the equivalent external credit
ratings, it is estimated that approximately 55-60% (2008 approximately 60-65%) of the unmitigated trade receivables portfolio exposure is of
investment grade credit quality. With respect to the trade and other receivables that are neither impaired nor past due, there are no indications as of
the reporting date that the debtors will not meet their payment obligations.
The group does not typically renegotiate the terms of trade receivables; however, if a renegotiation does take place, the outstanding balance is
included in the analysis based on the original payment terms. There were no significant renegotiated balances outstanding at 31 December 2009 or
31 December 2008.
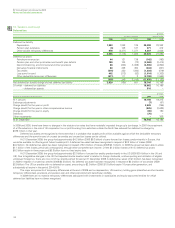
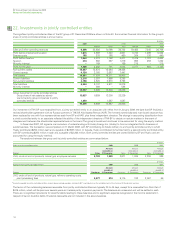
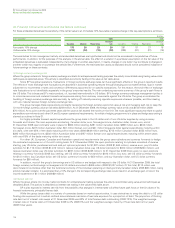
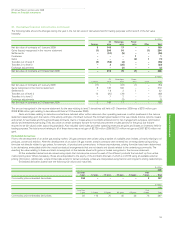
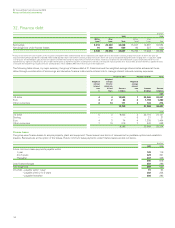
$ million
Trade and other receivables at 31 December 2009 2008
Neither impaired nor past due 29,426 25,838
Impaired (net of valuation allowance) 91 73
Not impaired and past due in the following periods
within 30 days 808 1,323
31 to 60 days 151 489
61 to 90 days 76 596
over 90 days 464 1,170
31,016 29,489
The movement in the valuation allowance for trade receivables is set out below.
$ million
Trade and other receivables at 31 December 2009 2008
At 1 January 391 406
Exchange adjustments 12 (32)
Charge for the year 157 191
Utilization (130) (174)
At 31 December 430 391
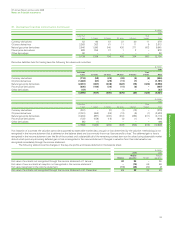
(c) Liquidity risk
Liquidity risk is the risk that suitable sources of funding for the group’s business activities may not be available. The group’s liquidity is managed
centrally with operating units forecasting their cash and currency requirements to the central treasury function. Unless restricted by local regulations,
subsidiaries pool their cash surpluses to treasury, which will then arrange to fund other subsidiaries’ requirements, or invest any net surplus in the
market or arrange for necessary external borrowings, while managing the group’s overall net currency positions.
In managing its liquidity risk, the group has access to a wide range of funding at competitive rates through capital markets and banks. The
group’s treasury function centrally co-ordinates relationships with banks, borrowing requirements, foreign exchange requirements and cash
management. The group believes it has access to sufficient funding through the commercial paper markets and by using undrawn committed
borrowing facilities to meet foreseeable borrowing requirements. At 31 December 2009, the group had substantial amounts of undrawn borrowing
facilities available, including committed facilities of $4,950 million, of which $4,550 million are in place through to the fourth quarter of 2011,
unchanged from the position as at 31 December 2008. These facilities are with a number of international banks and borrowings under them would
be at pre-agreed rates.
The group has in place a European Debt Issuance Programme (DIP) under which the group may raise $20 billion of debt for maturities of one
month or longer. At 31 December 2009, the amount drawn down against the DIP was $11,403 million (2008 $10,334 million). In addition, the group
has in place an unlimited US Shelf Registration under which it may raise debt with maturities of one month or longer.
The group has long-term debt ratings of Aa1 (stable outlook) and AA (stable outlook), assigned respectively by Moody’s and Standard and
Poor’s, unchanged from 2008.
Despite recent increased uncertainty in the financial markets, including a lack of liquidity for some borrowers, we have been able to issue
$11 billion of long-term debt during 2009 and issue short-term commercial paper at competitive rates, as and when required. As an additional
precautionary measure, we have increased and maintained the cash and cash equivalents held by the group to $8.3 billion at the end of 2009 and
$8.2 billion at the end of 2008, compared with $3.6 billion at the end of 2007.
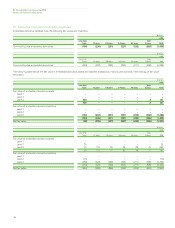
The amounts shown for finance debt in the table below include expected interest payments on borrowings and the future minimum lease
payments with respect to finance leases.