BP 2009 Annual Report Download - page 188
Download and view the complete annual report
Please find page 188 of the 2009 BP annual report below. You can navigate through the pages in the report by either clicking on the pages listed below, or by using the keyword search tool below to find specific information within the annual report.-
 1
1 -
2
-
3
-
4
-
5
-
6
-
7
-
8
-
9
-
10
-
11
-
12
-
13
-
14
-
15
-
16
-
17
-
18
-
19
-
20
-
21
-
22
-
23
-
24
-
25
-
26
-
27
-
28
-
29
-
30
-
31
-
32
-
33
-
34
-
35
-
36
-
37
-
38
-
39
-
40
-
41
-
42
-
43
-
44
-
45
-
46
-
47
-
48
-
49
-
50
-
51
-
52
-
53
-
54
-
55
-
56
-
57
-
58
-
59
-
60
-
61
-
62
-
63
-
64
-
65
-
66
-
67
-
68
-
69
-
70
-
71
-
72
-
73
-
74
-
75
-
76
-
77
-
78
-
79
-
80
-
81
-
82
-
83
-
84
-
85
-
86
-
87
-
88
-
89
-
90
-
91
-
92
-
93
-
94
-
95
-
96
-
97
-
98
-
99
-
100
-
101
-
102
-
103
-
104
-
105
-
106
-
107
-
108
-
109
-
110
-
111
-
112
-
113
-
114
-
115
-
116
-
117
-
118
-
119
-
120
-
121
-
122
-
123
-
124
-
125
-
126
-
127
-
128
-
129
-
130
-
131
-
132
-
133
-
134
-
135
-
136
-
137
-
138
-
139
-
140
-
141
-
142
-
143
-
144
-
145
-
146
-
147
-
148
-
149
-
150
-
151
-
152
-
153
-
154
-
155
-
156
-
157
-
158
-
159
-
160
-
161
-
162
-
163
-
164
-
165
-
166
-
167
-
168
-
169
-
170
-
171
-
172
-
173
-
174
-
175
-
176
-
177
-
 178
178 -
 179
179 -
 180
180 -
 181
181 -
 182
182 -
 183
183 -
 184
184 -
 185
185 -
 186
186 -
 187
187 -
 188
188 -
 189
189 -
 190
190 -
 191
191 -
 192
192 -
 193
193 -
 194
194 -
 195
195 -
 196
196 -
 197
197 -
 198
198 -
199
-
200
-
201
-
202
-
203
-
204
-
205
-
206
-
207
-
208
-
209
-
210
-
211
-
212
 |
 |

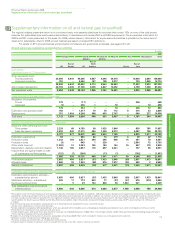
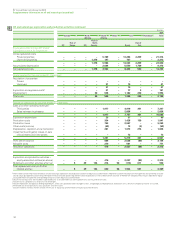
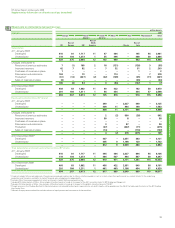
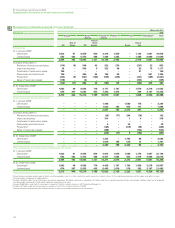
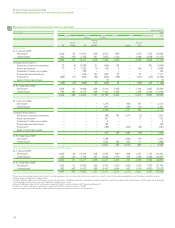
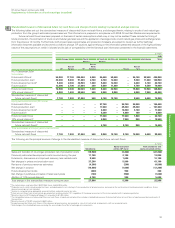
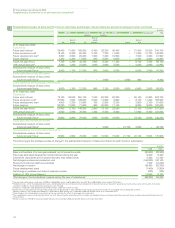
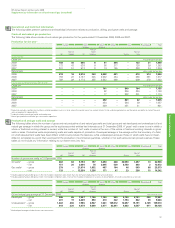
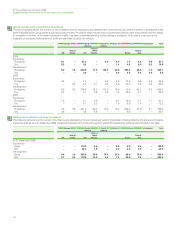
Movements in estimated net proved reserves continued
(3)
3
–
186
BP Annual Report and Accounts 2009
Supplementary information on oil and natural gas (unaudited)
billion cubic feet
Natural gasa2008
Europe North South Africa Asia Australasia Total
America America
Rest of
Rest of North Rest of
UK Europe US America Russia Asia
Subsidiaries
At 1 January 2008
Developed 2,049 63 10,670 608 3,075 990 – 1,270 1,135 19,860
Undeveloped 553 410 4,705 421 7,973 1,410 – 1,269 4,529 21,270
2,602 473 15,375 1,029 11,048 2,400 – 2,539 5,664 41,130
Changes attributable to
Revisions of previous estimates 23 (8) (2,063) 51 (456) 142 – – 361 (1,950)
Improved recovery 77 9 1,322 16 159 6 – 108 2 1,699
Purchases of reserves-in-place – – 183 ––––––183
Discoveries and extensions – – 549 125 948 82 – 37 – 1,741
Productionb(298) (11) (834) (94) (946) (198) – (274) (140) (2,795)
Sales of reserves-in-place ––––(3)––––
(198) (10) (843) 98 (298) 32 – (129) 223 (1,125)
At 31 December 2008c
Developed 1,822 61 9,059 659 3,316 1,050 – 1,102 1,887 18,956
Undeveloped 582 402 5,473 468 7,434 1,382 – 1,308 4,000 21,049
2,404 463 14,532 1,127 10,750 2,432 – 2,410 5,887 40,005
Equity-accounted entities (BP share)e
At 1 January 2008
Developed ––––1,478 – 808 187 – 2,473
Undeveloped ––––831 – 353 113 – 1,297
––––2,309 – 1,161 300 – 3,770
Changes attributable to
Revisions of previous estimates ––––(96) 182 1,273 (2) – 1,357
Improved recovery ––––301 – – 11 – 312
Purchases of reserves-in-place ––––3 ––––
Discoveries and extensions ––––192 ––––192
Productionb––––(188) – (221) (22) – (431)
Sales of reserves-in-place –––––––––
––––212 182 1,052 (13) – 1,433
At 31 December 2008d
Developed ––––1,498 – 1,560 176 – 3,234
Undeveloped ––––1,023 182 653 111 – 1,969
––––2,521 182 2,213 287 – 5,203
Total subsidiaries and equity-accounted entities (BP share)
At 1 January 2008
Developed 2,049 63 10,670 608 4,553 990 808 1,457 1,135 22,333
Undeveloped 553 410 4,705 421 8,804 1,410 353 1,382 4,529 22,567
2,602 473 15,375 1,029 13,357 2,400 1,161 2,839 5,664 44,900
At 31 December 2008
Developed 1,822 61 9,059 659 4,814 1,050 1,560 1,278 1,887 22,190
Undeveloped 582 402 5,473 468 8,457 1,564 653 1,419 4,000 23,018
2,404 463 14,532 1,127 13,271 2,614 2,213 2,697 5,887 45,208
aProved reserves exclude royalties due to others, whether payable in cash or in kind, where the royalty owner has a direct interest in the underlying production and the option and ability to make
lifting and sales arrangements independently.
bIncludes 193 billion cubic feet of natural gas consumed in operations, 149 billion cubic feet in subsidiaries, 44 billion cubic feet in equity-accounted entities and excludes 17 billion cubic feet of produced
non-hydrocarbon components which meet regulatory requirements for sales.
cIncludes 3,108 billion cubic feet of natural gas in respect of the 30% minority interest in BP Trinidad and Tobago LLC.
dIncludes 131 billion cubic feet of natural gas in respect of the 5.92% minority interest in TNK-BP.
eVolumes of equity-accounted entities include volumes of equity-accounted investments of those entities.