BP 2009 Annual Report Download - page 156
Download and view the complete annual report
Please find page 156 of the 2009 BP annual report below. You can navigate through the pages in the report by either clicking on the pages listed below, or by using the keyword search tool below to find specific information within the annual report.-
 1
1 -
2
-
3
-
4
-
5
-
6
-
7
-
8
-
9
-
10
-
11
-
12
-
13
-
14
-
15
-
16
-
17
-
18
-
19
-
20
-
21
-
22
-
23
-
24
-
25
-
26
-
27
-
28
-
29
-
30
-
31
-
32
-
33
-
34
-
35
-
36
-
37
-
38
-
39
-
40
-
41
-
42
-
43
-
44
-
45
-
46
-
47
-
48
-
49
-
50
-
51
-
52
-
53
-
54
-
55
-
56
-
57
-
58
-
59
-
60
-
61
-
62
-
63
-
64
-
65
-
66
-
67
-
68
-
69
-
70
-
71
-
72
-
73
-
74
-
75
-
76
-
77
-
78
-
79
-
80
-
81
-
82
-
83
-
84
-
85
-
86
-
87
-
88
-
89
-
90
-
91
-
92
-
93
-
94
-
95
-
96
-
97
-
98
-
99
-
100
-
101
-
102
-
103
-
104
-
105
-
106
-
107
-
108
-
109
-
110
-
111
-
112
-
113
-
114
-
115
-
116
-
117
-
118
-
119
-
120
-
121
-
122
-
123
-
124
-
125
-
126
-
127
-
128
-
129
-
130
-
131
-
132
-
133
-
134
-
135
-
136
-
137
-
138
-
139
-
140
-
141
-
142
-
143
-
144
-
145
-
 146
146 -
 147
147 -
 148
148 -
 149
149 -
 150
150 -
 151
151 -
 152
152 -
 153
153 -
 154
154 -
 155
155 -
 156
156 -
 157
157 -
 158
158 -
 159
159 -
 160
160 -
 161
161 -
 162
162 -
 163
163 -
 164
164 -
 165
165 -
 166
166 -
167
-
168
-
169
-
170
-
171
-
172
-
173
-
174
-
175
-
176
-
177
-
178
-
179
-
180
-
181
-
182
-
183
-
184
-
185
-
186
-
187
-
188
-
189
-
190
-
191
-
192
-
193
-
194
-
195
-
196
-
197
-
198
-
199
-
200
-
201
-
202
-
203
-
204
-
205
-
206
-
207
-
208
-
209
-
210
-
211
-
212
 |
 |

BP Annual Report and Accounts 2009
Notes on financial statements
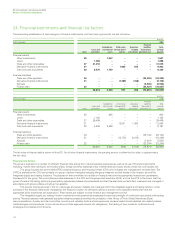
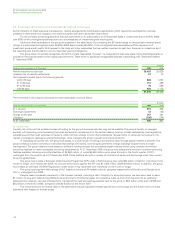
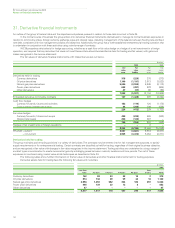
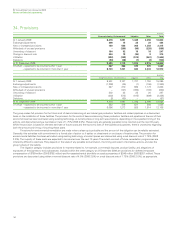
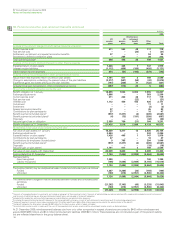
31. Derivative financial instruments continued
154
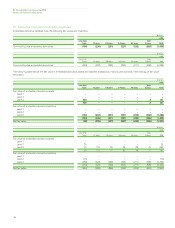
The following table shows the fair value of derivative assets and derivative liabilities held for trading, analysed by maturity period and by
methodology of fair value estimation.
IFRS 7 ‘Financial Instruments: Disclosures’ sets out a fair value hierarchy which consists of three levels that describe the methodology of
estimation as follows:
– Level 1 – using quoted prices in active markets for identical assets or liabilities.
– Level 2 – using inputs for the asset or liability, other than quoted prices, that are observable either directly (i.e. as prices) or indirectly (i.e. derived
from prices).
– Level 3 – using inputs for the asset or liability that are not based on observable market data such as prices based on internal models or other
valuation methods.
This information is presented on a gross basis, that is, before netting by counterparty.
$ million
2009
Less than Over
1 year 1-2 years 2-3 years 3-4 years 4-5 years 5 years Total
Fair value of derivative assets
Level 1 163 76 23 17 10 1 290
Level 2 9,544 2,182 915 357 146 – 13,144
Level 3 264 188 162 148 128 527 1,417
9,971 2,446 1,100 522 284 528 14,851
Less: netting by counterparty (5,494) (1,029) (384) (75) (35) (11) (7,028)
4,477 1,417 716 447 249 517 7,823
Fair value of derivative liabilities
Level 1 (95) (39) (14) (24) – (1) (173)
Level 2 (9,086) (1,681) (597) (234) (47) – (11,645)
Level 3 (269) (150) (109) (93) (74) (436) (1,131)
(9,450) (1,870) (720) (351) (121) (437) (12,949)
Less: netting by counterparty 5,494 1,029 384 75 35 11 7,028
(3,956) (841) (336) (276) (86) (426) (5,921)
Net fair value 521 576 380 171 163 91 1,902
$ million
2008
Less than Over
1 year 1-2 years 2-3 years 3-4 years 4-5 years 5 years Total
Fair value of derivative assets
Level 1 40 43 30 7 6 2 128
Level 2 19,737 3,477 871 508 225 56 24,874
Level 3 687 196 148 140 137 672 1,980
20,464 3,716 1,049 655 368 730 26,982
Less: netting by counterparty (12,325) (1,927) (345) (170) (64) (47) (14,878)
8,139 1,789 704 485 304 683 12,104
Fair value of derivative liabilities
Level 1 (227) – (2) – (13) – (242)
Level 2 (19,106) (3,345) (683) (356) (217) (27) (23,734)
Level 3 (551) (187) (154) (147) (140) (632) (1,811)
(19,884) (3,532) (839) (503) (370) (659) (25,787)
Less: netting by counterparty 12,325 1,927 345 170 64 47 14,878
(7,559) (1,605) (494) (333) (306) (612) (10,909)
Net fair value 580 184 210 152 (2) 71 1,195