Albertsons 2012 Annual Report Download - page 75
Download and view the complete annual report
Please find page 75 of the 2012 Albertsons annual report below. You can navigate through the pages in the report by either clicking on the pages listed below, or by using the keyword search tool below to find specific information within the annual report.-
 1
1 -
2
-
3
-
4
-
5
-
6
-
7
-
8
-
9
-
10
-
11
-
12
-
13
-
14
-
15
-
16
-
17
-
18
-
19
-
20
-
21
-
22
-
23
-
24
-
25
-
26
-
27
-
28
-
29
-
30
-
31
-
32
-
33
-
34
-
35
-
36
-
37
-
38
-
39
-
40
-
41
-
42
-
43
-
44
-
45
-
46
-
47
-
48
-
49
-
50
-
51
-
52
-
53
-
54
-
55
-
56
-
57
-
58
-
59
-
60
-
61
-
62
-
63
-
64
-
 65
65 -
 66
66 -
 67
67 -
 68
68 -
 69
69 -
 70
70 -
 71
71 -
 72
72 -
 73
73 -
 74
74 -
 75
75 -
 76
76 -
 77
77 -
 78
78 -
 79
79 -
 80
80 -
 81
81 -
 82
82 -
 83
83 -
 84
84 -
 85
85 -
86
-
87
-
88
-
89
-
90
-
91
-
92
-
93
-
94
-
95
-
96
-
97
-
98
-
99
-
100
-
101
-
102
-
103
-
104
-
105
-
106
-
107
-
108
-
109
-
110
-
111
-
112
-
113
-
114
-
115
-
116
 |
 |

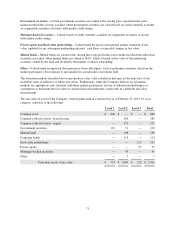
Government securities—Certain government securities are valued at the closing price reported in the active
market in which the security is traded. Other government securities are valued based on yields currently available
on comparable securities of issuers with similar credit ratings.
Mortgage-backed securities—Valued based on yields currently available on comparable securities of issuers
with similar credit ratings.
Private equity and Real estate partnerships—Valued using the most recent general partner statement of fair
value, updated for any subsequent partnership interests’ cash flows or expected changes in fair value.
Mutual funds—Mutual funds are valued at the closing price reported in the active market in which the individual
securities are traded. Other mutual funds are valued at NAV, which is based on the value of the underlying
securities owned by the fund and divided by the number of shares outstanding.
Other—Valued under an approach that maximizes observable inputs, such as gathering consensus data from the
market participant’s best estimate of mid-market for actual trades or positions held.
The valuation methods described above may produce a fair value calculation that may not be indicative of net
realizable value or reflective of future fair values. Furthermore, while the Company believes its valuations
methods are appropriate and consistent with other market participants, the use of different methodologies or
assumptions to determine the fair value of certain financial instruments could result in a different fair value
measurement.
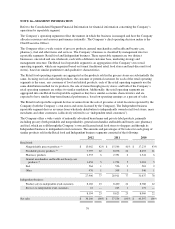
The fair value of assets of the Company’s benefit plans held in a master trust as of February 25, 2012, by asset
category, consisted of the following:
Level 1 Level 2 Level 3 Total
Common stock $ 606 $ — $ — $ 606
Common collective trusts—fixed income — 285 — 285
Common collective trusts—equity — 332 — 332
Government securities 119 91 — 210
Mutual funds — 198 — 198
Corporate bonds — 113 — 113
Real estate partnerships — — 125 125
Private equity — — 97 97
Mortgage-backed securities — 43 — 43
Other — 7 — 7
Total plan assets at fair value $ 725 $ 1,069 $ 222 $ 2,016
71