Albertsons 2012 Annual Report Download - page 43
Download and view the complete annual report
Please find page 43 of the 2012 Albertsons annual report below. You can navigate through the pages in the report by either clicking on the pages listed below, or by using the keyword search tool below to find specific information within the annual report.-
 1
1 -
2
-
3
-
4
-
5
-
6
-
7
-
8
-
9
-
10
-
11
-
12
-
13
-
14
-
15
-
16
-
17
-
18
-
19
-
20
-
21
-
22
-
23
-
24
-
25
-
26
-
27
-
28
-
29
-
30
-
31
-
32
-
 33
33 -
 34
34 -
 35
35 -
 36
36 -
 37
37 -
 38
38 -
 39
39 -
 40
40 -
 41
41 -
 42
42 -
 43
43 -
 44
44 -
 45
45 -
 46
46 -
 47
47 -
 48
48 -
 49
49 -
 50
50 -
 51
51 -
 52
52 -
 53
53 -
54
-
55
-
56
-
57
-
58
-
59
-
60
-
61
-
62
-
63
-
64
-
65
-
66
-
67
-
68
-
69
-
70
-
71
-
72
-
73
-
74
-
75
-
76
-
77
-
78
-
79
-
80
-
81
-
82
-
83
-
84
-
85
-
86
-
87
-
88
-
89
-
90
-
91
-
92
-
93
-
94
-
95
-
96
-
97
-
98
-
99
-
100
-
101
-
102
-
103
-
104
-
105
-
106
-
107
-
108
-
109
-
110
-
111
-
112
-
113
-
114
-
115
-
116
 |
 |
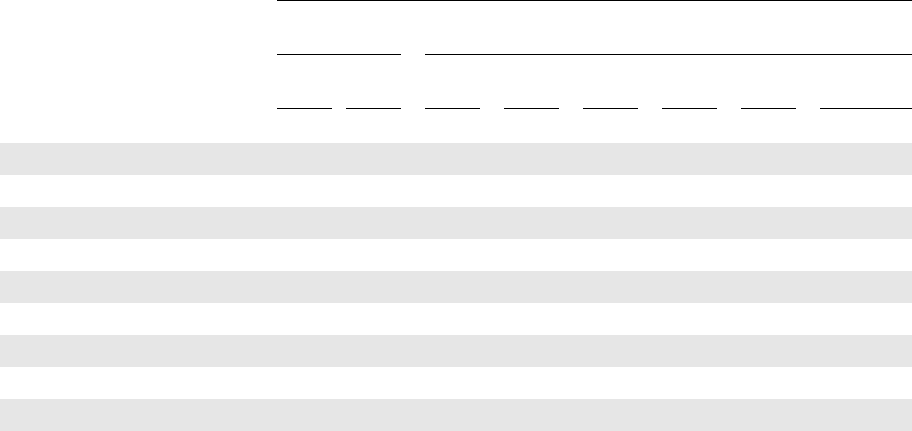
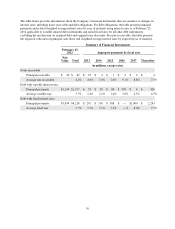
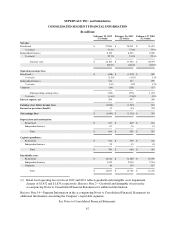
The table below provides information about the Company’s financial instruments that are sensitive to changes in
interest rates, including notes receivable and debt obligations. For debt obligations, the table presents principal
payments and related weighted average interest rates by year of maturity using interest rates as of February 25,
2012 applicable to variable interest debt instruments and stated fixed rates for all other debt instruments,
excluding the net discount on acquired debt and original issue discounts. For notes receivable, the table presents
the expected collection of principal cash flows and weighted average interest rates by expected year of maturity.
Summary of Financial Instruments
February 25,
2012 Aggregate payments by fiscal year
Fair
Value Total 2013 2014 2015 2016 2017 Thereafter
(in millions, except rates)
Notes receivable
Principal receivable $ 42 $ 42 $ 23 $ 4 $ 7 $ 2 $ 2 $ 4
Average rate receivable 6.2% 4.9% 7.8% 7.0% 9.1% 8.8% 7.5%
Debt with variable interest rates
Principal payments $1,154 $1,157 $ 33 $ 20 $ 84 $ 590 $ 4 $ 426
Average variable rate 3.7% 2.4% 2.1% 1.4% 3.6% 4.5% 4.5%
Debt with fixed interest rates
Principal payments $3,834 $4,218 $ 291 $ 176 $ 508 $ — $1,000 $ 2,243
Average fixed rate 7.7% 7.5% 7.1% 7.4% —% 8.0% 7.7%
39