Albertsons 2012 Annual Report Download - page 24
Download and view the complete annual report
Please find page 24 of the 2012 Albertsons annual report below. You can navigate through the pages in the report by either clicking on the pages listed below, or by using the keyword search tool below to find specific information within the annual report.-
 1
1 -
2
-
3
-
4
-
5
-
6
-
7
-
8
-
9
-
10
-
11
-
12
-
13
-
 14
14 -
 15
15 -
 16
16 -
 17
17 -
 18
18 -
 19
19 -
 20
20 -
 21
21 -
 22
22 -
 23
23 -
 24
24 -
 25
25 -
 26
26 -
 27
27 -
 28
28 -
 29
29 -
 30
30 -
 31
31 -
 32
32 -
 33
33 -
 34
34 -
35
-
36
-
37
-
38
-
39
-
40
-
41
-
42
-
43
-
44
-
45
-
46
-
47
-
48
-
49
-
50
-
51
-
52
-
53
-
54
-
55
-
56
-
57
-
58
-
59
-
60
-
61
-
62
-
63
-
64
-
65
-
66
-
67
-
68
-
69
-
70
-
71
-
72
-
73
-
74
-
75
-
76
-
77
-
78
-
79
-
80
-
81
-
82
-
83
-
84
-
85
-
86
-
87
-
88
-
89
-
90
-
91
-
92
-
93
-
94
-
95
-
96
-
97
-
98
-
99
-
100
-
101
-
102
-
103
-
104
-
105
-
106
-
107
-
108
-
109
-
110
-
111
-
112
-
113
-
114
-
115
-
116
 |
 |

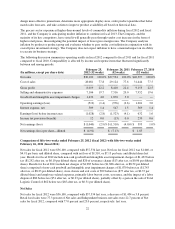
ITEM 6. SELECTED FINANCIAL DATA
(Dollars and shares in millions, except
percent and per share data)
2012
(52 weeks)
2011
(52 weeks)
2010
(52 weeks)
2009
(53 weeks)
2008
(52 weeks)
Operating Results
Net sales $ 36,100 $ 37,534 $ 40,597 $ 44,564 $ 44,048
Identical store retail sales increase
(decrease) (1) (2.8)% (6.0)% (5.1)% (1.2)% 0.5%
Cost of sales 28,081 29,124 31,444 34,451 33,943
Selling and administrative expenses 7,106 7,516 7,952 8,746 8,421
Goodwill and intangible asset
impairment charges (2) 1,432 1,870 — 3,524 —
Operating earnings (loss) (519) (976) 1,201 (2,157) 1,684
Interest expense, net 509 547 569 622 707
Earnings (loss) before income taxes (1,028) (1,523) 632 (2,779) 977
Income tax provision (benefit) 12 (13) 239 76 384
Net earnings (loss) (1,040) (1,510) 393 (2,855) 593
Net earnings (loss) as a percent of
net sales (2.88)% (4.02)% 0.97% (6.41)% 1.35%
Net earnings (loss) per share—
diluted (4.91) (7.13) 1.85 (13.51) 2.76
Financial Position
Inventories (FIFO) (3) $ 2,492 $ 2,552 $ 2,606 $ 2,967 $ 2,956
Working capital (3) (23) (84) (192) (109) (280)
Property, plant and equipment, net 6,362 6,604 7,026 7,528 7,533
Total assets 12,053 13,758 16,436 17,604 21,062
Debt and capital lease obligations 6,256 6,751 7,635 8,484 8,833
Stockholders’ equity 21 1,340 2,887 2,581 5,953
Other Statistics
Return on average stockholders’
equity (103.55)% (76.36)% 14.42% (59.32)% 10.44%
Book value per share $ 0.10 $ 6.32 $ 13.62 $ 12.19 $ 28.13
Current ratio (3) 0.99:1 0.98:1 0.95:1 0.98:1 0.94:1
Debt to capital ratio (4) 99.7% 83.4% 72.6% 76.7% 59.7%
Dividends declared per share $ 0.3500 $ 0.3500 $ 0.6100 $ 0.6875 $ 0.6750
Weighted average shares
outstanding—diluted 212 212 213 211 215
Depreciation and amortization $ 884 $ 925 $ 957 $ 1,057 $ 1,017
Capital expenditures (5) $ 700 $ 604 $ 691 $ 1,212 $ 1,227
Retail stores as of fiscal year end (6) 2,434 2,394 2,349 2,421 2,474
20