Albertsons 2012 Annual Report Download - page 47
Download and view the complete annual report
Please find page 47 of the 2012 Albertsons annual report below. You can navigate through the pages in the report by either clicking on the pages listed below, or by using the keyword search tool below to find specific information within the annual report.-
 1
1 -
2
-
3
-
4
-
5
-
6
-
7
-
8
-
9
-
10
-
11
-
12
-
13
-
14
-
15
-
16
-
17
-
18
-
19
-
20
-
21
-
22
-
23
-
24
-
25
-
26
-
27
-
28
-
29
-
30
-
31
-
32
-
33
-
34
-
35
-
36
-
 37
37 -
 38
38 -
 39
39 -
 40
40 -
 41
41 -
 42
42 -
 43
43 -
 44
44 -
 45
45 -
 46
46 -
 47
47 -
 48
48 -
 49
49 -
 50
50 -
 51
51 -
 52
52 -
 53
53 -
 54
54 -
 55
55 -
 56
56 -
 57
57 -
58
-
59
-
60
-
61
-
62
-
63
-
64
-
65
-
66
-
67
-
68
-
69
-
70
-
71
-
72
-
73
-
74
-
75
-
76
-
77
-
78
-
79
-
80
-
81
-
82
-
83
-
84
-
85
-
86
-
87
-
88
-
89
-
90
-
91
-
92
-
93
-
94
-
95
-
96
-
97
-
98
-
99
-
100
-
101
-
102
-
103
-
104
-
105
-
106
-
107
-
108
-
109
-
110
-
111
-
112
-
113
-
114
-
115
-
116
 |
 |

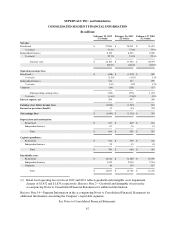
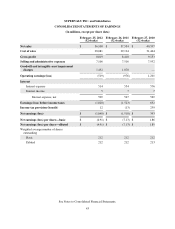
SUPERVALU INC. and Subsidiaries
CONSOLIDATED STATEMENTS OF EARNINGS
(In millions, except per share data)
February 25, 2012
(52 weeks)
February 26, 2011
(52 weeks)
February 27, 2010
(52 weeks)
Net sales $ 36,100 $ 37,534 $ 40,597
Cost of sales 28,081 29,124 31,444
Gross profit 8,019 8,410 9,153
Selling and administrative expenses 7,106 7,516 7,952
Goodwill and intangible asset impairment
charges 1,432 1,870 —
Operating earnings (loss) (519) (976) 1,201
Interest
Interest expense 514 554 576
Interest income 5 7 7
Interest expense, net 509 547 569
Earnings (loss) before income taxes (1,028) (1,523) 632
Income tax provision (benefit) 12 (13) 239
Net earnings (loss) $ (1,040) $ (1,510) $ 393
Net earnings (loss) per share—basic $ (4.91) $ (7.13) $ 1.86
Net earnings (loss) per share—diluted $ (4.91) $ (7.13) $ 1.85
Weighted average number of shares
outstanding
Basic 212 212 212
Diluted 212 212 213
See Notes to Consolidated Financial Statements.
43