Albertsons 2012 Annual Report Download - page 25
Download and view the complete annual report
Please find page 25 of the 2012 Albertsons annual report below. You can navigate through the pages in the report by either clicking on the pages listed below, or by using the keyword search tool below to find specific information within the annual report.-
 1
1 -
2
-
3
-
4
-
5
-
6
-
7
-
8
-
9
-
10
-
11
-
12
-
13
-
14
-
 15
15 -
 16
16 -
 17
17 -
 18
18 -
 19
19 -
 20
20 -
 21
21 -
 22
22 -
 23
23 -
 24
24 -
 25
25 -
 26
26 -
 27
27 -
 28
28 -
 29
29 -
 30
30 -
 31
31 -
 32
32 -
 33
33 -
 34
34 -
 35
35 -
36
-
37
-
38
-
39
-
40
-
41
-
42
-
43
-
44
-
45
-
46
-
47
-
48
-
49
-
50
-
51
-
52
-
53
-
54
-
55
-
56
-
57
-
58
-
59
-
60
-
61
-
62
-
63
-
64
-
65
-
66
-
67
-
68
-
69
-
70
-
71
-
72
-
73
-
74
-
75
-
76
-
77
-
78
-
79
-
80
-
81
-
82
-
83
-
84
-
85
-
86
-
87
-
88
-
89
-
90
-
91
-
92
-
93
-
94
-
95
-
96
-
97
-
98
-
99
-
100
-
101
-
102
-
103
-
104
-
105
-
106
-
107
-
108
-
109
-
110
-
111
-
112
-
113
-
114
-
115
-
116
 |
 |

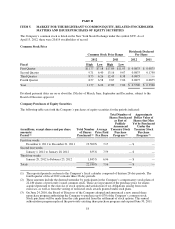
(1) The change in identical store sales is calculated as the change in net sales for stores operating for four full
quarters, including store expansions and excluding fuel and planned store dispositions. Fiscal 2008 identical
store sales are calculated as if the Acquired Operations stores were in the identical store base for four full
quarters in fiscal 2008 and 2007.
(2) The Company recorded goodwill and intangible asset impairment charges of $1,432 before tax ($1,292 after
tax, or $6.10 per diluted share) in fiscal 2012, $1,870 before tax ($1,743 after tax, or $8.23 per diluted share)
in fiscal 2011 and $3,524 before tax ($3,326 after tax, or $15.71 per diluted share) in fiscal 2009.
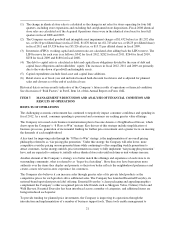
(3) Inventories (FIFO), working capital and current ratio are calculated after adding back the LIFO reserve. The
LIFO reserve for each year is as follows: $342 for fiscal 2012, $282 for fiscal 2011, $264 for fiscal 2010,
$258 for fiscal 2009 and $180 for fiscal 2008.
(4) The debt to capital ratio is calculated as debt and capital lease obligations divided by the sum of debt and
capital lease obligations and stockholders’ equity. The increases in fiscal 2012, 2011 and 2009 are primarily
due to the write-down of goodwill and intangible assets.
(5) Capital expenditures include fixed asset and capital lease additions.
(6) Retail stores as of fiscal year end includes licensed hard-discount food stores and is adjusted for planned
sales and closures as of the end of each fiscal year.
Historical data is not necessarily indicative of the Company’s future results of operations or financial condition.
See discussion of “Risk Factors” in Part I, Item 1A of this Annual Report on Form 10-K.
ITEM 7. MANAGEMENT’S DISCUSSION AND ANALYSIS OF FINANCIAL CONDITION AND
RESULTS OF OPERATIONS
RESULTS OF OPERATIONS
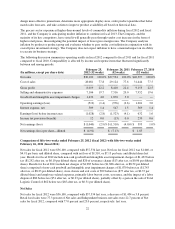
The challenging economic environment has continued to negatively impact consumer confidence and spending in
fiscal 2012. As a result, consumer spending is pressured and consumers are seeking greater value offerings.
The Company is focused on its business transformation plan to become America’s Neighborhood Grocer, which
draws upon the Company’s “8 Plays to Win” strategy. Key drivers of this strategy include simplification of
business processes, generation of incremental funding for further price investment and a greater focus on meeting
the demands of each neighborhood.
A key tenet for improving sales through the “8 Plays to Win” strategy, is the implementation of an overall pricing
philosophy referred to as “fair pricing plus promotion.” Under this strategy, the Company will offer lower, more
competitive everyday pricing on non-promoted items while continuing to offer compelling weekly promotions to
attract customers. As the strategy unfolds, price investments necessary to fully implement “fair pricing plus promotion”
have, and are expected to continue to, initially reduce identical store sales until such time as unit volumes increase.
Another element of the Company’s strategy is to better match the offerings and experience of each store to its
surrounding community, what is referred to as “hyper-local retailing”. Store directors have been given more
authority over the items they display and promote so their store better reflects the neighborhood preferences and
creates a more relevant in-store experience for customers.
The Company also believes it can increase sales through greater sales of its private label products as the
competitive prices for such products drive additional sales. The Company has launched Essential Everyday, its
national-brand-equivalent private label offering. Essential Everyday’s clean packaging and appealing graphics
complement the Company’s other recognized private label brands such as Shoppers Value, Culinary Circle and
Wild Harvest. Essential Everyday has been introduced across a number of categories, and additional items are
being introduced each quarter.
To provide funding for planned price investments, the Company is improving its operations through the
introduction and implementation of a number of business support tools. These tools enable management to
21