Albertsons 2012 Annual Report Download - page 29
Download and view the complete annual report
Please find page 29 of the 2012 Albertsons annual report below. You can navigate through the pages in the report by either clicking on the pages listed below, or by using the keyword search tool below to find specific information within the annual report.-
 1
1 -
2
-
3
-
4
-
5
-
6
-
7
-
8
-
9
-
10
-
11
-
12
-
13
-
14
-
15
-
16
-
17
-
18
-
 19
19 -
 20
20 -
 21
21 -
 22
22 -
 23
23 -
 24
24 -
 25
25 -
 26
26 -
 27
27 -
 28
28 -
 29
29 -
 30
30 -
 31
31 -
 32
32 -
 33
33 -
 34
34 -
 35
35 -
 36
36 -
 37
37 -
 38
38 -
 39
39 -
40
-
41
-
42
-
43
-
44
-
45
-
46
-
47
-
48
-
49
-
50
-
51
-
52
-
53
-
54
-
55
-
56
-
57
-
58
-
59
-
60
-
61
-
62
-
63
-
64
-
65
-
66
-
67
-
68
-
69
-
70
-
71
-
72
-
73
-
74
-
75
-
76
-
77
-
78
-
79
-
80
-
81
-
82
-
83
-
84
-
85
-
86
-
87
-
88
-
89
-
90
-
91
-
92
-
93
-
94
-
95
-
96
-
97
-
98
-
99
-
100
-
101
-
102
-
103
-
104
-
105
-
106
-
107
-
108
-
109
-
110
-
111
-
112
-
113
-
114
-
115
-
116
 |
 |
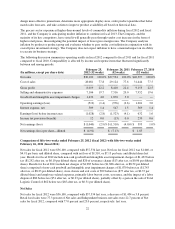
Interest Expense, Net
Net interest expense was $509 in fiscal 2012, compared with $547 last year, primarily reflecting lower average
debt levels in fiscal 2012 compared to last year.
Income Tax Provision (Benefit)
The income tax expense for fiscal 2012 was $12 compared with an income tax benefit of $13 last year. Taxes for
fiscal 2012 and 2011 reflect the impact of the goodwill and intangible asset impairment charges, the majority of
which are non-deductible for income tax purposes.
Net Loss
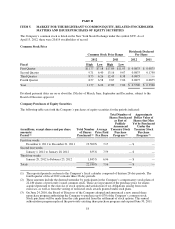
Net loss was $1,040, or $4.91 per basic and diluted share, for fiscal 2012 compared with a net loss of $1,510, or
$7.13 per basic and diluted share last year. Net loss for fiscal 2012 includes goodwill and intangible asset
impairment charges of $1,432 before tax ($1,292 after tax, or $6.10 per basic and diluted share) and employee
related severance charges of $20 before tax ($13 after tax, or $0.06 per basic and diluted share). Net loss for
fiscal 2011 includes goodwill and intangible asset impairment charges, store closure and exit costs and certain
other costs consisting primarily of labor buyout costs, severance and the impact of a labor dispute of $1,806 after
tax, or $8.52 per basic and diluted share, including the impact of a $62 gain on the sale of Total Logistic Control
($65 after tax, or $0.31 per basic and diluted share).
Comparison of fifty-two weeks ended February 26, 2011 (fiscal 2011) with fifty-two weeks ended
February 27, 2010 (fiscal 2010):
Net sales for fiscal 2011 were $37,534, compared with $40,597 for fiscal 2010. Net loss for fiscal 2011 was
$1,510, or $7.13 per basic and diluted share, compared with net earnings of $393, or $1.86 per basic share and
$1.85 per diluted share for fiscal 2010. Results for fiscal 2011 include net charges of $1,987 before tax ($1,806
after tax, or $8.52 per diluted share) comprised of non-cash goodwill and intangible asset impairment charges of
$1,870 before tax ($1,743 after tax, or $8.23 per diluted share), store closure and exit costs of $99 before tax ($77
after tax, or $0.37 per diluted share) and employee-related expenses, primarily labor buyout costs, severance, and
the impact of a labor dispute of $80 before tax ($51 after tax, or $0.23 per diluted share), partially offset by a
gain on the sale of Total Logistic Control of $62 before tax ($65 after tax, or $0.31 per diluted share).
Net Sales
Net sales for fiscal 2011 were $37,534, compared with $40,597 for fiscal 2010, a decrease of $3,063 or 7.5%.
Retail food net sales were 77.0 percent of Net sales and Independent business net sales were 23.0 percent of Net
sales for fiscal 2011, compared with 77.9 percent and 22.1 percent, respectively, in fiscal 2010.
Retail food sales for fiscal 2011 were $28,911, compared with $31,637 last year, a decrease of $2,726, or 8.6
percent. The decrease primarily reflects negative identical store retail sales of 6.0 percent, or $1,627 (defined as
stores operating for four full quarters, including store expansions and excluding fuel and planned store
dispositions) and the impact of market exits and store dispositions of $1,271. Identical store retail sales
performance was primarily a result of heightened value-focused competitive activity and the impact of the
challenging economic environment on consumers. Customer count declined approximately 400 basis points and
average basket size decreased approximately 2.0 percent during fiscal 2011 driven by fewer items per customer
offset in part by moderate levels of inflation.
During fiscal 2011 the Company added 132 new stores through new store development, comprised of three
traditional retail food stores and 129 hard-discount food stores, and sold or closed 87 stores, including planned
dispositions, of which 50 were traditional retail food stores and 37 were hard-discount food stores. Total retail
25