Albertsons 2012 Annual Report Download - page 23
Download and view the complete annual report
Please find page 23 of the 2012 Albertsons annual report below. You can navigate through the pages in the report by either clicking on the pages listed below, or by using the keyword search tool below to find specific information within the annual report.-
 1
1 -
2
-
3
-
4
-
5
-
6
-
7
-
8
-
9
-
10
-
11
-
12
-
 13
13 -
 14
14 -
 15
15 -
 16
16 -
 17
17 -
 18
18 -
 19
19 -
 20
20 -
 21
21 -
 22
22 -
 23
23 -
 24
24 -
 25
25 -
 26
26 -
 27
27 -
 28
28 -
 29
29 -
 30
30 -
 31
31 -
 32
32 -
 33
33 -
34
-
35
-
36
-
37
-
38
-
39
-
40
-
41
-
42
-
43
-
44
-
45
-
46
-
47
-
48
-
49
-
50
-
51
-
52
-
53
-
54
-
55
-
56
-
57
-
58
-
59
-
60
-
61
-
62
-
63
-
64
-
65
-
66
-
67
-
68
-
69
-
70
-
71
-
72
-
73
-
74
-
75
-
76
-
77
-
78
-
79
-
80
-
81
-
82
-
83
-
84
-
85
-
86
-
87
-
88
-
89
-
90
-
91
-
92
-
93
-
94
-
95
-
96
-
97
-
98
-
99
-
100
-
101
-
102
-
103
-
104
-
105
-
106
-
107
-
108
-
109
-
110
-
111
-
112
-
113
-
114
-
115
-
116
 |
 |
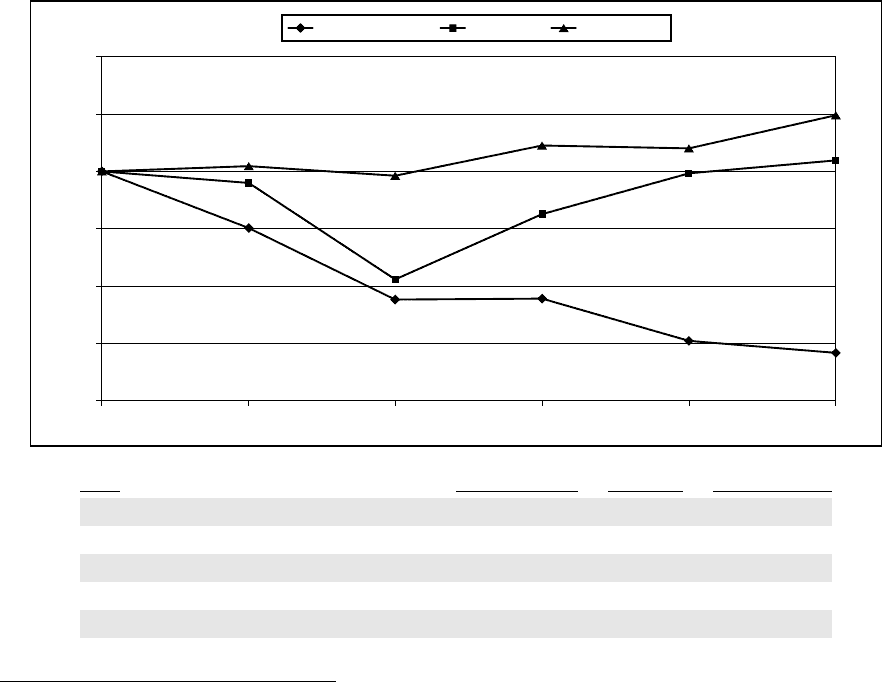
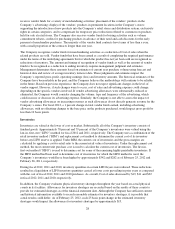
Stock Performance Graph
The following graph compares the yearly change in the Company’s cumulative shareholder return on its common
stock for the period from the end of fiscal 2007 to the end of fiscal 2012 to that of the Standard & Poor’s
(“S&P”) 500 and a group of peer companies in the retail grocery industry. The stock price performance shown
below is not necessarily indicative of future performance.
COMPARISON OF CUMULATIVE TOTAL SHAREHOLDER RETURN AMONG
SUPERVALU, S&P 500 AND PEER GROUP (1)
February 23, 2007 through February 24, 2012 (2)
$0
$50
$25
$75
$125
$100
$150
Feb-12Feb-11Feb-10Feb-09Feb-08Feb-07
S&P 500 Peer GroupSUPERVALU
Date SUPERVALU S&P 500 Peer Group (3)
February 23, 2007 $100.00 $100.00 $100.00
February 22, 2008 $ 75.39 $ 95.03 $102.45
February 27, 2009 $ 44.06 $ 52.97 $ 98.16
February 26, 2010 $ 44.48 $ 81.37 $111.34
February 25, 2011 $ 26.03 $ 99.18 $110.11
February 24, 2012 $ 20.90 $104.84 $124.69
(1) Total return assuming $100 invested on February 23, 2007 and reinvestment of dividends on the day they
were paid.
(2) The Company’s fiscal year ends on the last Saturday in February.
(3) The Company’s peer group consists of Delhaize Group SA, Koninklijke Ahold NV, The Kroger Co.,
Safeway Inc. and Wal-Mart Stores, Inc. Great Atlantic & Pacific Tea Company, Inc. was a member of the
Company’s peer group prior to fiscal 2012 but was removed due to their bankruptcy proceedings.
The performance graph above is being furnished solely to accompany this Annual Report on Form 10-K pursuant
to Item 201(e) of Regulation S-K, is not being filed for purposes of Section 18 of the Exchange Act, and is not to
be incorporated by reference into any filing of the Company, whether made before or after the date hereof,
regardless of any general incorporation language in such filing.
19