Albertsons 2012 Annual Report Download - page 27
Download and view the complete annual report
Please find page 27 of the 2012 Albertsons annual report below. You can navigate through the pages in the report by either clicking on the pages listed below, or by using the keyword search tool below to find specific information within the annual report.-
 1
1 -
2
-
3
-
4
-
5
-
6
-
7
-
8
-
9
-
10
-
11
-
12
-
13
-
14
-
15
-
16
-
 17
17 -
 18
18 -
 19
19 -
 20
20 -
 21
21 -
 22
22 -
 23
23 -
 24
24 -
 25
25 -
 26
26 -
 27
27 -
 28
28 -
 29
29 -
 30
30 -
 31
31 -
 32
32 -
 33
33 -
 34
34 -
 35
35 -
 36
36 -
 37
37 -
38
-
39
-
40
-
41
-
42
-
43
-
44
-
45
-
46
-
47
-
48
-
49
-
50
-
51
-
52
-
53
-
54
-
55
-
56
-
57
-
58
-
59
-
60
-
61
-
62
-
63
-
64
-
65
-
66
-
67
-
68
-
69
-
70
-
71
-
72
-
73
-
74
-
75
-
76
-
77
-
78
-
79
-
80
-
81
-
82
-
83
-
84
-
85
-
86
-
87
-
88
-
89
-
90
-
91
-
92
-
93
-
94
-
95
-
96
-
97
-
98
-
99
-
100
-
101
-
102
-
103
-
104
-
105
-
106
-
107
-
108
-
109
-
110
-
111
-
112
-
113
-
114
-
115
-
116
 |
 |
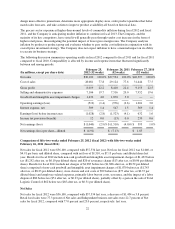
Retail food sales for fiscal 2012 were $27,906, compared with $28,911 last year, a decrease of $1,005, or 3.5
percent. The decrease is primarily due to market exits and store dispositions of $765 and negative identical store
retail sales of 2.8% over fiscal 2011 or $691 (defined as stores operating for four full quarters, including store
expansions and excluding fuel and planned store dispositions). Negative identical store retail sales performance
was primarily a result of heightened value-focused competitive activity and the impact of the challenging
economic environment on consumers. During fiscal 2012, customer count declined approximately 3.8 percent
while average basket size increased approximately 1.1 percent driven by moderate levels of inflation, offset in
part by fewer items per customer.
During fiscal 2012 the Company added 83 new stores through new store development, comprised of one
traditional retail food store and 82 hard-discount food stores, and sold or closed 43 stores, including planned
dispositions, of which 13 were traditional retail food stores and 30 were hard-discount food stores. Total retail
square footage as of the end of fiscal 2012 was approximately 64 million, a decrease of 0.4 percent from the end
of fiscal 2011. Total retail square footage, excluding actual and planned store dispositions, increased 0.8 percent
from the end of fiscal 2011. New stores and licensed hard-discount stores contributed $481 to retail sales
increases in fiscal 2012.
Independent business sales for fiscal 2012 were $8,194, compared with $8,623 last year, a decrease of $429 or
5.0 percent. The decrease is primarily due to reduced volume from a national retail customer’s transition of
volume to self-distribution and the sale of Total Logistic Control in the fourth quarter of fiscal 2011, which on a
combined basis resulted in decreased sales of $536. Sales to existing independent retail customers increased
$107.
Gross Profit
Gross profit for fiscal 2012 was $8,019, compared with $8,410 last year, a decrease of $391, or 4.6 percent. The
decrease in Gross profit dollars is primarily due to a decline in the Company’s sales volume. Negative identical
store Retail food sales, previously announced market exits and store dispositions combined with the divestiture of
Total Logistic Control and volume lost to self-distribution resulted in decreases in Gross profit of $381.
Gross profit, as a percent of Net sales, was 22.2 percent for fiscal 2012 compared with 22.4 percent last year.
Retail food gross profit as a percent of Retail food Net sales was 27.3 percent for fiscal 2012 compared with 27.5
percent last year. The 20 basis point decrease in Retail food gross profit rate is due to a 30 basis point decline
from changes in business mix and increased advertising and other costs, and a 10 basis point decline in gross
profit due to a higher LIFO charge. Partially offsetting these amounts are a 20 basis point increase due to the
impact of improved effectiveness of promotional activities and lower costs, net of the Company’s investments in
lower retail prices.
Independent business gross profit as a percent of Independent business Net sales was 4.8 percent for fiscal 2012
compared with 5.4 percent last year. The 60 basis point decrease in Independent business profit is primarily
related to the divestiture of Total Logistic Control and the impact of a national retail customer’s transition to self-
distribution.
Selling and Administrative Expenses
Selling and administrative expenses for fiscal 2012 were $7,106, compared with $7,516 last year, a decrease of
$410, or 5.5 percent. Reductions in Selling and administrative expenses reflect the impact of charges related to
store closure and exit costs, labor buyouts, and labor disputes totaling $150 recorded in fiscal 2011, reduced costs
due to lower fiscal 2012 sales volumes, store closures, and market exits, net of sales deleveraging totaling $264.
Selling and administrative expenses also decreased due to lower store support costs, employee benefit costs and
occupancy costs of $64, and from a fiscal 2012 gain of $15 recorded to correct the calculation of workers’
compensation liabilities to exclude security program payments. The Company recorded a $20 charge related to
workforce reductions in fiscal 2012 and also recorded a $62 gain on the sale of Total Logistic Control in fiscal
2011 which offset the above items.
Selling and administrative expenses for fiscal 2012 were 19.7 percent of net sales compared to 20.0 percent of
net sales last year. The 30 basis point decrease in selling and administrative expenses as a percent of net sales in
23