Albertsons 2012 Annual Report Download - page 50
Download and view the complete annual report
Please find page 50 of the 2012 Albertsons annual report below. You can navigate through the pages in the report by either clicking on the pages listed below, or by using the keyword search tool below to find specific information within the annual report.-
 1
1 -
2
-
3
-
4
-
5
-
6
-
7
-
8
-
9
-
10
-
11
-
12
-
13
-
14
-
15
-
16
-
17
-
18
-
19
-
20
-
21
-
22
-
23
-
24
-
25
-
26
-
27
-
28
-
29
-
30
-
31
-
32
-
33
-
34
-
35
-
36
-
37
-
38
-
39
-
 40
40 -
 41
41 -
 42
42 -
 43
43 -
 44
44 -
 45
45 -
 46
46 -
 47
47 -
 48
48 -
 49
49 -
 50
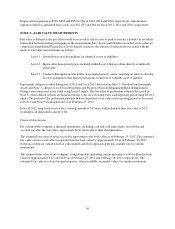
50 -
 51
51 -
 52
52 -
 53
53 -
 54
54 -
 55
55 -
 56
56 -
 57
57 -
 58
58 -
 59
59 -
 60
60 -
61
-
62
-
63
-
64
-
65
-
66
-
67
-
68
-
69
-
70
-
71
-
72
-
73
-
74
-
75
-
76
-
77
-
78
-
79
-
80
-
81
-
82
-
83
-
84
-
85
-
86
-
87
-
88
-
89
-
90
-
91
-
92
-
93
-
94
-
95
-
96
-
97
-
98
-
99
-
100
-
101
-
102
-
103
-
104
-
105
-
106
-
107
-
108
-
109
-
110
-
111
-
112
-
113
-
114
-
115
-
116
 |
 |

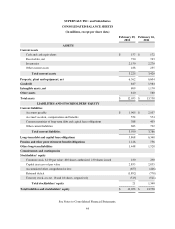
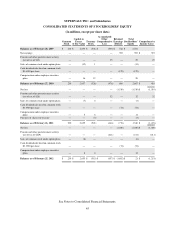
SUPERVALU INC. and Subsidiaries
CONSOLIDATED STATEMENTS OF CASH FLOWS
(In millions)
February 25,
2012
(52 weeks)
February 26,
2011
(52 weeks)
February 27,
2010
(52 weeks)
Cash flows from operating activities
Net earnings (loss) $ (1,040) $ (1,510) $ 393
Adjustments to reconcile net earnings (loss) to net cash provided by operating
activities:
Goodwill and intangible asset impairment charges 1,432 1,870 —
Asset impairment and other charges 10 116 74
Gain on sale of assets (32) (52) (33)
Depreciation and amortization 884 925 957
LIFO charge 60 18 8
Deferred income taxes (112) (94) 151
Stock-based compensation 13 15 31
Net pension and other postretirement benefits cost 120 102 33
Contributions to pension and other postretirement benefit plans (93) (169) (132)
Other adjustments 20 41 27
Changes in operating assets and liabilities:
Receivables (2) 46 55
Inventories 52 21 326
Accounts payable and accrued liabilities (175) (103) (267)
Income taxes payable, net of income taxes receivable 65 73 (170)
Other changes in operating assets and liabilities (146) (136) 21
Net cash provided by operating activities 1,056 1,163 1,474
Cash flows from investing activities
Proceeds from sale of assets 171 360 215
Purchases of property, plant and equipment (661) (597) (681)
Other 610 7
Net cash used in investing activities (484) (227) (459)
Cash flows from financing activities
Proceeds from issuance of long-term debt 291 180 943
Payment of long-term debt and capital lease obligations (794) (1,065) (1,830)
Dividends paid (74) (74) (147)
Net proceeds from the sale of common stock under option plans and related tax
benefits —2—
Payment for purchase of treasury shares — (3) —
Other (10) (15) (10)
Net cash used in financing activities (587) (975) (1,044)
Net decrease in cash and cash equivalents (15) (39) (29)
Cash and cash equivalents at beginning of year 172 211 240
Cash and cash equivalents at end of year $ 157 $ 172 $ 211
SUPPLEMENTAL CASH FLOW INFORMATION
The Company’s non-cash activities were as follows:
Capital lease asset additions and related obligations $ 39 $ 7 $ 10
Purchases of property, plant and equipment included in Accounts payable $ 113 $ 69 $ 69
Interest and income taxes paid:
Interest paid (net of amount capitalized) $ 478 $ 513 $ 538
Income taxes paid (net of refunds) $ 73 $ 11 $ 187
See Notes to Consolidated Financial Statements.
46