Albertsons 2012 Annual Report Download - page 2
Download and view the complete annual report
Please find page 2 of the 2012 Albertsons annual report below. You can navigate through the pages in the report by either clicking on the pages listed below, or by using the keyword search tool below to find specific information within the annual report.-
 1
1 -
 2
2 -
 3
3 -
 4
4 -
 5
5 -
 6
6 -
 7
7 -
 8
8 -
 9
9 -
 10
10 -
 11
11 -
 12
12 -
 13
13 -
14
-
15
-
16
-
17
-
18
-
19
-
20
-
21
-
22
-
23
-
24
-
25
-
26
-
27
-
28
-
29
-
30
-
31
-
32
-
33
-
34
-
35
-
36
-
37
-
38
-
39
-
40
-
41
-
42
-
43
-
44
-
45
-
46
-
47
-
48
-
49
-
50
-
51
-
52
-
53
-
54
-
55
-
56
-
57
-
58
-
59
-
60
-
61
-
62
-
63
-
64
-
65
-
66
-
67
-
68
-
69
-
70
-
71
-
72
-
73
-
74
-
75
-
76
-
77
-
78
-
79
-
80
-
81
-
82
-
83
-
84
-
85
-
86
-
87
-
88
-
89
-
90
-
91
-
92
-
93
-
94
-
95
-
96
-
97
-
98
-
99
-
100
-
101
-
102
-
103
-
104
-
105
-
106
-
107
-
108
-
109
-
110
-
111
-
112
-
113
-
114
-
115
-
116
 |
 |

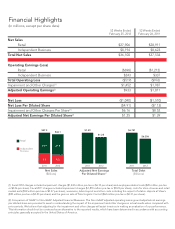
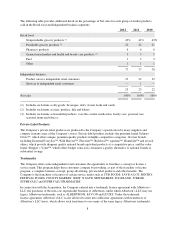
Financial Highlights
(In millions, except per share data)
52 Weeks Ended
February 25, 2012
52 Weeks Ended
February 26, 2011
Net Sales
Retail $27,906 $28,911
Independent Business $8,194 $8,623
Total Net Sales $36,100 $37,534
Operating Earnings (Loss)
Retail ($698) ($1,212)
Independent Business $243 $337
Total Operating Loss ($519) ($976)
Impairment and Other Charges(1) $1,452 $1,987
Adjusted Operating Earnings(2) $933 $1,011
Net Loss ($1,040) ($1,510)
Net Loss Per Diluted Share ($4.91) ($7.13)
Impairment and Other Charges Per Share(1) $6.16 $8.52
Adjusted Net Earnings Per Diluted Share(2) $1.25 $1.39
(1) Fiscal 2012 charges included impairment charges ($1,432 million pre-tax or $6.10 per share) and employee-related costs ($20 million pre-tax
or $0.06 per share). Fiscal 2011 charges included impairment charges ($1,870 million pre-tax or $8.23 per share), costs for store closures and retail
market exits ($99 million pre-tax or $0.37 per share), severance, labor buyout and other costs including the impact of a labor dispute at Shaw’s
($80 million pre-tax or $0.23 per share) and the gain on sale of Total Logistic Control ($62 million pre-tax or $0.31 per share).
(2) Comparison of GAAP to Non-GAAP Adjusted Financial Measures. The Non-GAAP adjusted operating earnings and adjusted net earnings
per diluted share are provided to assist in understanding the impact of the impairment and other charges on actual results when compared with
prior periods. We believe that adjusting for the impairment and other charges will assist investors in making an evaluation of our performance.
This information should not be construed as an alternative to the reported results, which have been determined in accordance with accounting
principles generally accepted in the United States of America.
Net Sales
(Billions)
2011
8.6
28.9
$37.5
2012
8.2
27.9
$36.1
Adjusted Net Earnings
Per Diluted Share(1)
2011
$1.39
2012
$1.25
Total Debt
(Billions)
2011
$6.751
2012
$6.256
Independent
Business
Retail
•Dividendreinvestment
•Automaticdepositofdividendchecks
•Certicatereplacements
•Accountmaintenance
•Transferofshares
•Nameoraddresschange