Albertsons 2012 Annual Report Download - page 30
Download and view the complete annual report
Please find page 30 of the 2012 Albertsons annual report below. You can navigate through the pages in the report by either clicking on the pages listed below, or by using the keyword search tool below to find specific information within the annual report.-
 1
1 -
2
-
3
-
4
-
5
-
6
-
7
-
8
-
9
-
10
-
11
-
12
-
13
-
14
-
15
-
16
-
17
-
18
-
19
-
 20
20 -
 21
21 -
 22
22 -
 23
23 -
 24
24 -
 25
25 -
 26
26 -
 27
27 -
 28
28 -
 29
29 -
 30
30 -
 31
31 -
 32
32 -
 33
33 -
 34
34 -
 35
35 -
 36
36 -
 37
37 -
 38
38 -
 39
39 -
 40
40 -
41
-
42
-
43
-
44
-
45
-
46
-
47
-
48
-
49
-
50
-
51
-
52
-
53
-
54
-
55
-
56
-
57
-
58
-
59
-
60
-
61
-
62
-
63
-
64
-
65
-
66
-
67
-
68
-
69
-
70
-
71
-
72
-
73
-
74
-
75
-
76
-
77
-
78
-
79
-
80
-
81
-
82
-
83
-
84
-
85
-
86
-
87
-
88
-
89
-
90
-
91
-
92
-
93
-
94
-
95
-
96
-
97
-
98
-
99
-
100
-
101
-
102
-
103
-
104
-
105
-
106
-
107
-
108
-
109
-
110
-
111
-
112
-
113
-
114
-
115
-
116
 |
 |
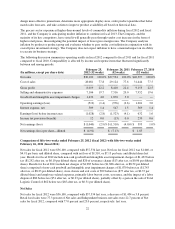
square footage as of the end of fiscal 2011 was approximately 64 million, a decrease of 1.7 percent from the end
of fiscal 2010. Total retail square footage, excluding actual and planned store dispositions, increased 1.7 percent
from the end of fiscal 2010. New stores and licensed hard-discount stores contributed $172 to retail sales
increases in fiscal 2011.
Independent business sales for fiscal 2011 were $8,623, compared with $8,960 last year, a decrease of $337 or
3.8 percent. The decrease of $337 is primarily due to the combination of reduced volume resulting from the
completion of a national retail customer’s transition of volume to self-distribution and the loss of a key customer
due to acquisition by a competitor totaling $363, net of new business during fiscal 2011.
Gross Profit
Gross profit for fiscal 2011 was $8,410, compared with $9,153 last year, a decrease of $743, or 8.1 percent. The
decrease in Gross profit dollars is primarily due to a decline in the Company’s sales volume. Negative identical
store Retail food sales as well as market exits and store dispositions resulted in decreases in retail Gross profit of
$736.
Gross profit, as a percent of Net sales, was 22.4 percent for fiscal 2011 compared with 22.5 percent in fiscal
2010. The 10 basis point decrease in gross profit is primarily attributable to a 20 basis point decline in gross
margin rate due to the impact of Independent business sales mix and the 10 basis point impact to margin due to a
labor dispute, offset partially by a 20 basis point margin improvement from lower promotional sales mix. Retail
food gross profit as a percent of Retail food Net sales was 27.5 percent for fiscal 2011 compared with 27.4
percent last year. Independent business gross profit as a percent of Independent business Net sales for fiscal 2011
was consistent with last year at 5.4 percent.
Selling and Administrative Expenses
Selling and administrative expenses for fiscal 2011 were $7,516, compared with $7,952 last year, a decrease of
$436, or 5.5 percent. Reductions in Selling and administrative expenses were primarily comprised of lower sales
volume, store closures, and market exits, net of sales deleveraging totaling $467 and a $62 gain on the sale of
Total Logistic Control. These factors were offset in part by a $150 charge related to store closure and exit costs,
labor buyouts, and labor disputes in fiscal 2011. In fiscal 2010 the Company recorded $62 in net charges related
to market exits, store closure of non-strategic stores and fees received from the early termination of a supply
agreement.
Selling and administrative expenses for fiscal 2011 were 20.0 percent of net sales compared to 19.6 percent of
net sales in fiscal 2010. The 40 basis points increase in selling and administrative expenses as a percent of net
sales in fiscal 2011 is primarily due to a 50 basis point increase from reduced sales leverage, a 30 basis points
increase in store closure and exit costs, labor buyouts, and labor disputes for charges recorded in fiscal 2011.
Partially offsetting these increases were a 20 basis point improvement for net charges related to market exits,
store closure of non-strategic stores and fees received from the early termination of a supply agreement recorded
in fiscal 2010 and a 20 basis point impact due to the gain on sale of Total Logistic Control in fiscal 2011.
Goodwill and Intangible Asset Impairment Charges
During fiscal 2011 the Company recorded non-cash impairment charges of $1,870 in the Retail food segment,
comprised of a $1,619 reduction to the carrying value of goodwill, a $221 reduction to the carrying value of
intangible assets with indefinite useful lives, and a $30 reduction related to the carrying value of certain Acquired
Trademarks. The non-cash impairment charges recorded during 2011 were primarily attributable to the
significant decline in its market capitalization and the impact of the challenging economic environment on the
Company’s operations. No goodwill impairment charges were recorded in fiscal 2010.
26