Albertsons 2012 Annual Report Download - page 26
Download and view the complete annual report
Please find page 26 of the 2012 Albertsons annual report below. You can navigate through the pages in the report by either clicking on the pages listed below, or by using the keyword search tool below to find specific information within the annual report.-
 1
1 -
2
-
3
-
4
-
5
-
6
-
7
-
8
-
9
-
10
-
11
-
12
-
13
-
14
-
15
-
 16
16 -
 17
17 -
 18
18 -
 19
19 -
 20
20 -
 21
21 -
 22
22 -
 23
23 -
 24
24 -
 25
25 -
 26
26 -
 27
27 -
 28
28 -
 29
29 -
 30
30 -
 31
31 -
 32
32 -
 33
33 -
 34
34 -
 35
35 -
 36
36 -
37
-
38
-
39
-
40
-
41
-
42
-
43
-
44
-
45
-
46
-
47
-
48
-
49
-
50
-
51
-
52
-
53
-
54
-
55
-
56
-
57
-
58
-
59
-
60
-
61
-
62
-
63
-
64
-
65
-
66
-
67
-
68
-
69
-
70
-
71
-
72
-
73
-
74
-
75
-
76
-
77
-
78
-
79
-
80
-
81
-
82
-
83
-
84
-
85
-
86
-
87
-
88
-
89
-
90
-
91
-
92
-
93
-
94
-
95
-
96
-
97
-
98
-
99
-
100
-
101
-
102
-
103
-
104
-
105
-
106
-
107
-
108
-
109
-
110
-
111
-
112
-
113
-
114
-
115
-
116
 |
 |

design more effective promotions, determine more appropriate display sizes, order product quantities that better
match sales forecasts, and take actions to improve product availability-all based on historical data.
The grocery sector experienced higher-than-normal levels of commodity inflation during fiscal 2012 and fiscal
2011, and the Company is anticipating modest inflation to continue in fiscal 2013. The Company, and the
majority of its key competitors, have stated it will generally pass through vendor cost increases in the form of
higher retail prices, thus mitigating the potential impact of lower gross margin rates. The Company analyzes
inflation by product or product group and evaluates whether to pass on the cost inflation in conjunction with its
overall price investment strategy. The Company does not expect inflation to have a material impact on its ability
to execute its business strategy.
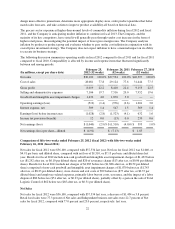
The following discussion summarizes operating results in fiscal 2012 compared to fiscal 2011 and for fiscal 2011
compared to fiscal 2010. Comparability is affected by income and expense items that fluctuated significantly
between and among periods:
(In millions, except per share data)
February 25,
2012 (52 weeks)
February 26, 2011
(52 weeks)
February 27, 2010
(52 weeks)
Net sales $36,100 100.0% $37,534 100.0% $40,597 100.0%
Cost of sales 28,081 77.8 29,124 77.6 31,444 77.5
Gross profit 8,019 22.2 8,410 22.4 9,153 22.5
Selling and administrative expenses 7,106 19.7 7,516 20.0 7,952 19.6
Goodwill and intangible asset impairment charges 1,432 4.0 1,870 5.0 — —
Operating earnings (loss) (519) (1.4) (976) (2.6) 1,201 3.0
Interest expense, net 509 1.4 547 1.5 569 1.4
Earnings (loss) before income taxes (1,028) (2.8) (1,523) (4.1) 632 1.6
Income tax provision (benefit) 12 0.0 (13) 0.0 239 0.6
Net earnings (loss) $ (1,040) (2.9)% $ (1,510) (4.0)% $ 393 1.0%
Net earnings (loss) per share—diluted $ (4.91) $ (7.13) $ 1.85
Comparison of fifty-two weeks ended February 25, 2012 (fiscal 2012) with fifty-two weeks ended
February 26, 2011 (fiscal 2011):
Net sales for fiscal 2012 were $36,100, compared with $37,534 last year. Net loss for fiscal 2012 was $1,040, or
$4.91 per basic and diluted share, compared with net loss of $1,510, or $7.13 per basic and diluted share last
year. Results for fiscal 2012 include non-cash goodwill and intangible asset impairment charges of $1,432 before
tax ($1,292 after tax, or $6.10 per diluted share) and $20 of severance charge ($13 after tax, or $0.06 per diluted
share). Results for fiscal 2011 include net charges of $1,987 before tax ($1,806 after tax, or $8.52 per diluted
share) comprised of non-cash goodwill and intangible asset impairment charges of $1,870 before tax ($1,743
after tax, or $8.23 per diluted share), store closure and exit costs of $99 before tax ($77 after tax, or $0.37 per
diluted share) and employee-related expenses, primarily labor buyout costs, severance, and the impact of a labor
dispute of $80 before tax ($51 after tax, or $0.23 per diluted share), partially offset by a gain on the sale of Total
Logistic Control of $62 before tax ($65 after tax, or $0.31 per diluted share).
Net Sales
Net sales for fiscal 2012 were $36,100, compared with $37,534 last year, a decrease of $1,434 or 3.8 percent.
Retail food sales were 77.3 percent of Net sales and Independent business net sales were 22.7 percent of Net
sales for fiscal 2012, compared with 77.0 percent and 23.0 percent, respectively, last year.
22