Albertsons 2012 Annual Report Download - page 73
Download and view the complete annual report
Please find page 73 of the 2012 Albertsons annual report below. You can navigate through the pages in the report by either clicking on the pages listed below, or by using the keyword search tool below to find specific information within the annual report.-
 1
1 -
2
-
3
-
4
-
5
-
6
-
7
-
8
-
9
-
10
-
11
-
12
-
13
-
14
-
15
-
16
-
17
-
18
-
19
-
20
-
21
-
22
-
23
-
24
-
25
-
26
-
27
-
28
-
29
-
30
-
31
-
32
-
33
-
34
-
35
-
36
-
37
-
38
-
39
-
40
-
41
-
42
-
43
-
44
-
45
-
46
-
47
-
48
-
49
-
50
-
51
-
52
-
53
-
54
-
55
-
56
-
57
-
58
-
59
-
60
-
61
-
62
-
 63
63 -
 64
64 -
 65
65 -
 66
66 -
 67
67 -
 68
68 -
 69
69 -
 70
70 -
 71
71 -
 72
72 -
 73
73 -
 74
74 -
 75
75 -
 76
76 -
 77
77 -
 78
78 -
 79
79 -
 80
80 -
 81
81 -
 82
82 -
 83
83 -
84
-
85
-
86
-
87
-
88
-
89
-
90
-
91
-
92
-
93
-
94
-
95
-
96
-
97
-
98
-
99
-
100
-
101
-
102
-
103
-
104
-
105
-
106
-
107
-
108
-
109
-
110
-
111
-
112
-
113
-
114
-
115
-
116
 |
 |

At February 25, 2012, the Company converted to the 2012 Static Mortality Table for Annuitants and
Non-Annuitants for calculating the pension and postretirement obligations and the fiscal 2013 expense. The
impact of this change increased the February 25, 2012 projected benefit obligation by $10 and the accumulated
postretirement benefit obligation by $1. This change will also increase the fiscal 2013 defined benefit pension
plans expense by $2.
Assumptions
Weighted average assumptions used to determine benefit obligations and net periodic benefit cost consisted of
the following:
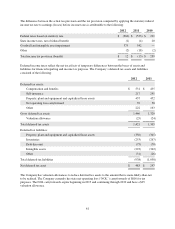
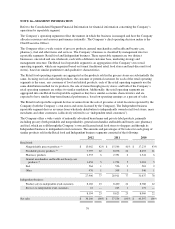
2012 2011 2010
Benefit obligation assumptions:
Discount rate (2) 4.55% 5.60% 6.00%
Rate of compensation increase 2.00% 2.00% 3.00%
Net periodic benefit cost assumptions: (1)
Discount rate (2) 5.60% 6.00% 7.35%
Rate of compensation increase 2.00% 3.00% 3.25%
Expected return on plan assets (3) 7.50% 7.75% 8.00%
(1) Net periodic benefit cost is measured using weighted average assumptions as of the beginning of each year.
(2) The Company reviews and selects the discount rate to be used in connection with its pension and other
postretirement obligations annually. In determining the discount rate, the Company uses the yield on
corporate bonds (rated AA or better) that coincides with the cash flows of the plans’ estimated benefit
payouts. The model uses a yield curve approach to discount each cash flow of the liability stream at an
interest rate specifically applicable to the timing of each respective cash flow. The model totals the present
values of all cash flows and calculates the equivalent weighted average discount rate by imputing the
singular interest rate that equates the total present value with the stream of future cash flows. This resulting
weighted average discount rate is then used in evaluating the final discount rate to be used by the Company.
(3) Expected long-term return on plan assets is estimated by utilizing forward-looking, long-term return, risk
and correlation assumptions developed and updated annually by the Company. These assumptions are
weighted by the actual or target allocation to each underlying asset class represented in the pension plan
asset portfolio. The Company also assesses the expected long-term return on plan assets assumption by
comparison to long-term historical performance on an asset class to ensure the assumption is reasonable.
Long-term trends are also evaluated relative to market factors such as inflation, interest rates, and fiscal and
monetary policies in order to assess the capital market assumptions.
The Company calculates its expected return on plan assets by using the market related value of plan assets. The
market related value of plan assets is determined by adjusting the actual fair value of plan assets for unrecognized
gains or losses on plan assets. Unrecognized gains or losses represent the difference between actual returns and
expected returns on plan assets for each fiscal year and are recognized by the Company evenly over a three year
period. Since the market-related value of assets recognizes gains or losses over a three-year period, the future
value of assets will be impacted as previously deferred gains or losses are recognized.
For those retirees whose health plans provide for variable employer contributions, the assumed healthcare cost
trend rate used in measuring the accumulated postretirement benefit obligation before and after age 65 was 7.75
percent, as of February 25, 2012. The assumed healthcare cost trend rate for retirees before and after age 65 will
decrease by 0.25 percent for each of the next five years, through fiscal 2018, 0.50 percent in fiscal 2018, and 1.0
percent in fiscal 2019, until it reaches the ultimate trend rate of 5.0 percent. For those retirees whose health plans
69