Albertsons 2012 Annual Report Download - page 65
Download and view the complete annual report
Please find page 65 of the 2012 Albertsons annual report below. You can navigate through the pages in the report by either clicking on the pages listed below, or by using the keyword search tool below to find specific information within the annual report.-
 1
1 -
2
-
3
-
4
-
5
-
6
-
7
-
8
-
9
-
10
-
11
-
12
-
13
-
14
-
15
-
16
-
17
-
18
-
19
-
20
-
21
-
22
-
23
-
24
-
25
-
26
-
27
-
28
-
29
-
30
-
31
-
32
-
33
-
34
-
35
-
36
-
37
-
38
-
39
-
40
-
41
-
42
-
43
-
44
-
45
-
46
-
47
-
48
-
49
-
50
-
51
-
52
-
53
-
54
-
 55
55 -
 56
56 -
 57
57 -
 58
58 -
 59
59 -
 60
60 -
 61
61 -
 62
62 -
 63
63 -
 64
64 -
 65
65 -
 66
66 -
 67
67 -
 68
68 -
 69
69 -
 70
70 -
 71
71 -
 72
72 -
 73
73 -
 74
74 -
 75
75 -
76
-
77
-
78
-
79
-
80
-
81
-
82
-
83
-
84
-
85
-
86
-
87
-
88
-
89
-
90
-
91
-
92
-
93
-
94
-
95
-
96
-
97
-
98
-
99
-
100
-
101
-
102
-
103
-
104
-
105
-
106
-
107
-
108
-
109
-
110
-
111
-
112
-
113
-
114
-
115
-
116
 |
 |
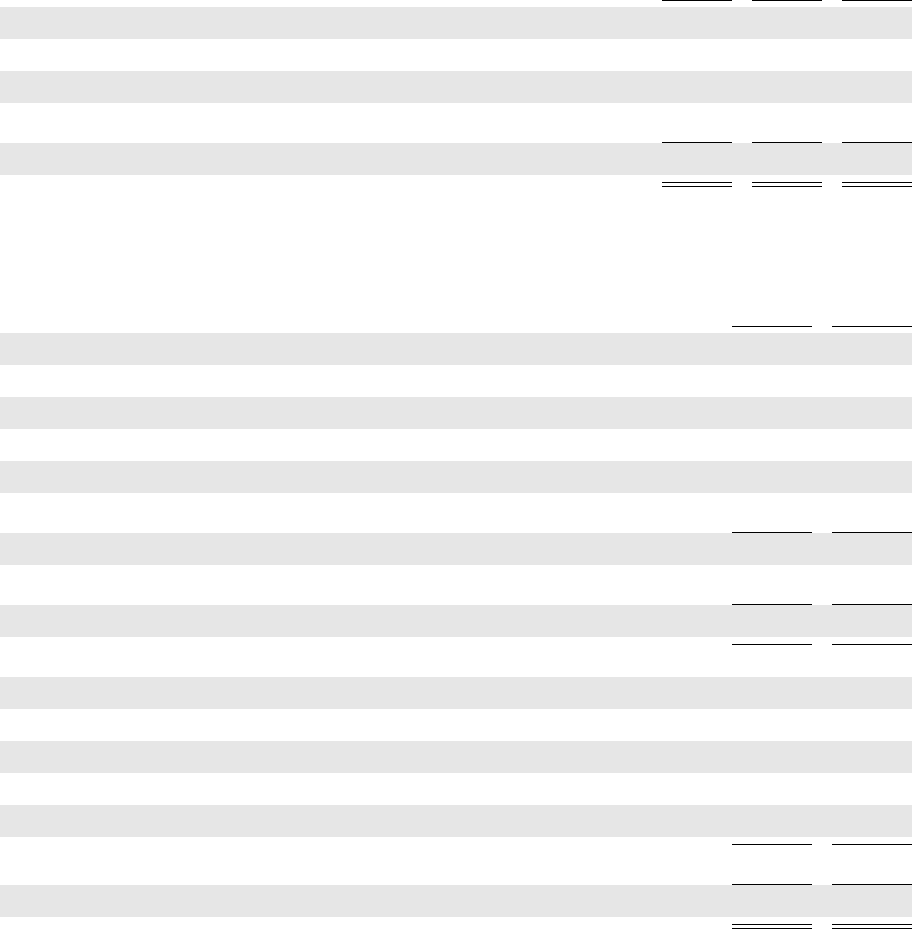
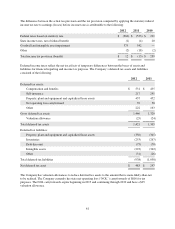
The difference between the actual tax provision and the tax provision computed by applying the statutory federal
income tax rate to earnings (losses) before income taxes is attributable to the following:
2012 2011 2010
Federal taxes based on statutory rate $ (360) $ (533) $ 221
State income taxes, net of federal benefit (1) (4) 20
Goodwill and intangible asset impairment 375 542 —
Other (2) (18) (2)
Total income tax provision (benefit) $ 12 $ (13) $ 239
Deferred income taxes reflect the net tax effects of temporary differences between the bases of assets and
liabilities for financial reporting and income tax purposes. The Company’s deferred tax assets and liabilities
consisted of the following:
2012 2011
Deferred tax assets:
Compensation and benefits $ 531 $ 435
Self-insurance 217 241
Property, plant and equipment and capitalized lease assets 437 452
Net operating loss carryforward 39 38
Other 222 163
Gross deferred tax assets 1,446 1,329
Valuation allowance (25) (24)
Total deferred tax assets 1,421 1,305
Deferred tax liabilities:
Property, plant and equipment and capitalized lease assets (356) (345)
Inventories (253) (267)
Debt discount (75) (78)
Intangible assets (223) (342)
Other (31) (26)
Total deferred tax liabilities (938) (1,058)
Net deferred tax asset $ 483 $ 247
The Company has valuation allowances to reduce deferred tax assets to the amount that is more-likely-than-not
to be realized. The Company currently has state net operating loss (“NOL”) carryforwards of $816 for tax
purposes. The NOL carryforwards expire beginning in 2013 and continuing through 2030 and have a $25
valuation allowance.
61