Albertsons 2012 Annual Report Download - page 49
Download and view the complete annual report
Please find page 49 of the 2012 Albertsons annual report below. You can navigate through the pages in the report by either clicking on the pages listed below, or by using the keyword search tool below to find specific information within the annual report.-
 1
1 -
2
-
3
-
4
-
5
-
6
-
7
-
8
-
9
-
10
-
11
-
12
-
13
-
14
-
15
-
16
-
17
-
18
-
19
-
20
-
21
-
22
-
23
-
24
-
25
-
26
-
27
-
28
-
29
-
30
-
31
-
32
-
33
-
34
-
35
-
36
-
37
-
38
-
 39
39 -
 40
40 -
 41
41 -
 42
42 -
 43
43 -
 44
44 -
 45
45 -
 46
46 -
 47
47 -
 48
48 -
 49
49 -
 50
50 -
 51
51 -
 52
52 -
 53
53 -
 54
54 -
 55
55 -
 56
56 -
 57
57 -
 58
58 -
 59
59 -
60
-
61
-
62
-
63
-
64
-
65
-
66
-
67
-
68
-
69
-
70
-
71
-
72
-
73
-
74
-
75
-
76
-
77
-
78
-
79
-
80
-
81
-
82
-
83
-
84
-
85
-
86
-
87
-
88
-
89
-
90
-
91
-
92
-
93
-
94
-
95
-
96
-
97
-
98
-
99
-
100
-
101
-
102
-
103
-
104
-
105
-
106
-
107
-
108
-
109
-
110
-
111
-
112
-
113
-
114
-
115
-
116
 |
 |

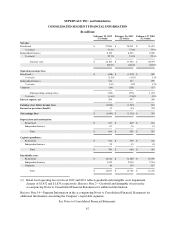
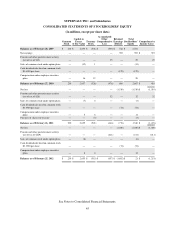
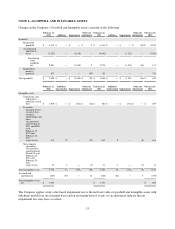
SUPERVALU INC. and Subsidiaries
CONSOLIDATED STATEMENTS OF STOCKHOLDERS’ EQUITY
(In millions, except per share data)
Common
Stock
Capital in
Excess
of Par Value
Treasury
Stock
Accumulated
Other
Comprehensive
Loss
Retained
Earnings
(Deficit)
Total
Stockholders’
Equity
Comprehensive
Income (Loss)
Balances as of February 28, 2009 $ 230 $ 2,853 $ (541) $ (503) $ 542 $ 2,581
Net earnings — — — — 393 393 $ 393
Pension and other postretirement activity
(net of tax of $13) — — — 25 — 25 25
Sales of common stock under option plans — (12) 1 — — (11) —
Cash dividends declared on common stock
$0.6100 per share — — — — (129) (129) —
Compensation under employee incentive
plans — 16 12 — — 28 —
Balances as of February 27, 2010 230 2,857 (528) (478) 806 2,887 $ 418
Net loss — — — — (1,510) (1,510) $ (1,510)
Pension and other postretirement activity
(net of tax of $28) — — — 32 — 32 32
Sales of common stock under option plans — (7) 4 — — (3) —
Cash dividends declared on common stock
$0.3500 per share — — — — (74) (74) —
Compensation under employee incentive
plans — 5 6 — — 11 —
Purchase of shares for treasury — — (3) — — (3) —
Balances as of February 26, 2011 230 2,855 (521) (446) (778) 1,340 $ (1,478)
Net loss — — — — (1,040) (1,040) $ (1,040)
Pension and other postretirement activity
(net of tax of $129) — — — (211) — (211) (211)
Sales of common stock under option plans — (8) — — — (8) —
Cash dividends declared on common stock
$0.3500 per share — — — — (74) (74) —
Compensation under employee incentive
plans — 8 6 — — 14 —
Balances as of February 25, 2012 $ 230 $ 2,855 $ (515) $ (657) $ (1,892) $ 21 $ (1,251)
See Notes to Consolidated Financial Statements.
45