Albertsons 2012 Annual Report Download - page 46
Download and view the complete annual report
Please find page 46 of the 2012 Albertsons annual report below. You can navigate through the pages in the report by either clicking on the pages listed below, or by using the keyword search tool below to find specific information within the annual report.-
 1
1 -
2
-
3
-
4
-
5
-
6
-
7
-
8
-
9
-
10
-
11
-
12
-
13
-
14
-
15
-
16
-
17
-
18
-
19
-
20
-
21
-
22
-
23
-
24
-
25
-
26
-
27
-
28
-
29
-
30
-
31
-
32
-
33
-
34
-
35
-
 36
36 -
 37
37 -
 38
38 -
 39
39 -
 40
40 -
 41
41 -
 42
42 -
 43
43 -
 44
44 -
 45
45 -
 46
46 -
 47
47 -
 48
48 -
 49
49 -
 50
50 -
 51
51 -
 52
52 -
 53
53 -
 54
54 -
 55
55 -
 56
56 -
57
-
58
-
59
-
60
-
61
-
62
-
63
-
64
-
65
-
66
-
67
-
68
-
69
-
70
-
71
-
72
-
73
-
74
-
75
-
76
-
77
-
78
-
79
-
80
-
81
-
82
-
83
-
84
-
85
-
86
-
87
-
88
-
89
-
90
-
91
-
92
-
93
-
94
-
95
-
96
-
97
-
98
-
99
-
100
-
101
-
102
-
103
-
104
-
105
-
106
-
107
-
108
-
109
-
110
-
111
-
112
-
113
-
114
-
115
-
116
 |
 |

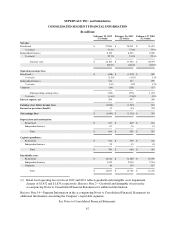
SUPERVALU INC. and Subsidiaries
CONSOLIDATED SEGMENT FINANCIAL INFORMATION
(In millions)
February 25, 2012
(52 weeks)
February 26, 2011
(52 weeks)
February 27, 2010
(52 weeks)
Net sales
Retail food $ 27,906 $ 28,911 $ 31,637
% of total 77.3% 77.0% 77.9%
Independent business 8,194 8,623 8,960
% of total 22.7% 23.0% 22.1%
Total net sales $ 36,100 $ 37,534 $ 40,597
100.0% 100.0% 100.0%
Operating earnings (loss)
Retail food (1) $ (698) $ (1,212) $ 989
% of sales (2.5)% (4.2)% 3.1%
Independent business 243 337 299
% of sales 3.0% 3.9% 3.3%
Corporate (64) (101) (87)
Total operating earnings (loss) (519) (976) 1,201
% of sales (1.4)% (2.6)% 3.0%
Interest expense, net 509 547 569
Earnings (loss) before income taxes (1,028) (1,523) 632
Income tax provision (benefit) 12 (13) 239
Net earnings (loss) $ (1,040) $ (1,510) $ 393
Depreciation and amortization
Retail food $ 817 $ 849 $ 876
Independent business 67 76 81
Total $ 884 $ 925 $ 957
Capital expenditures
Retail food $ 641 $ 559 $ 642
Independent business 59 45 49
Total $ 700 $ 604 $ 691
Identifiable assets
Retail food $ 10,014 $ 11,589 $ 14,035
Independent business 1,955 2,050 2,214
Corporate 84 119 187
Total $ 12,053 $ 13,758 $ 16,436
(1) Retail food operating loss for fiscal 2012 and 2011 reflects goodwill and intangible asset impairment
charges of $1,432 and $1,870, respectively. Refer to Note 2—Goodwill and Intangible Assets in the
accompanying Notes to Consolidated Financial Statements for additional information.
Refer to Note 14—Segment Information in the accompanying Notes to Consolidated Financial Statements for
additional information concerning the Company’s reportable segments.
See Notes to Consolidated Financial Statements.
42