eBay 2008 Annual Report Download - page 88
Download and view the complete annual report
Please find page 88 of the 2008 eBay annual report below. You can navigate through the pages in the report by either clicking on the pages listed below, or by using the keyword search tool below to find specific information within the annual report.-
 1
1 -
2
-
3
-
4
-
5
-
6
-
7
-
8
-
9
-
10
-
11
-
12
-
13
-
14
-
15
-
16
-
17
-
18
-
19
-
20
-
21
-
22
-
23
-
24
-
25
-
26
-
27
-
28
-
29
-
30
-
31
-
32
-
33
-
34
-
35
-
36
-
37
-
38
-
39
-
40
-
41
-
42
-
43
-
44
-
45
-
46
-
47
-
48
-
49
-
50
-
51
-
52
-
53
-
54
-
55
-
56
-
57
-
58
-
59
-
60
-
61
-
62
-
63
-
64
-
65
-
66
-
67
-
68
-
69
-
70
-
71
-
72
-
73
-
74
-
75
-
76
-
77
-
 78
78 -
 79
79 -
 80
80 -
 81
81 -
 82
82 -
 83
83 -
 84
84 -
 85
85 -
 86
86 -
 87
87 -
 88
88 -
 89
89 -
 90
90 -
 91
91 -
 92
92 -
 93
93 -
 94
94 -
 95
95 -
 96
96 -
 97
97 -
 98
98 -
99
-
100
-
101
-
102
-
103
-
104
-
105
-
106
-
107
-
108
-
109
-
110
-
111
-
112
-
113
-
114
-
115
-
116
-
117
-
118
-
119
-
120
-
121
-
122
-
123
-
124
 |
 |

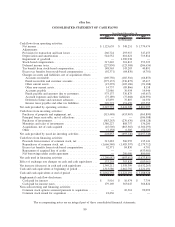
eBay Inc.
CONSOLIDATED STATEMENT OF CASH FLOWS
2006 2007 2008
Year Ended December 31,
(in thousands)
Cash flows from operating activities:
Net income ....................................... $1,125,639 $ 348,251 $ 1,779,474
Adjustments:
Provision for transaction and loan losses ................. 266,724 293,917 347,453
Depreciation and amortization ......................... 544,552 601,621 719,814
Impairment of goodwill .............................. — 1,390,938 —
Stock-based compensation ............................ 317,410 301,813 353,323
Deferred income taxes ............................... (227,850) (123,568) (206,636)
Tax benefit from stock-based compensation ............... 148,565 143,203 40,891
Excess tax benefits from stock-based compensation ......... (92,371) (84,830) (4,701)
Changes in assets and liabilities, net of acquisition effects:
Accounts receivable ............................... (169,750) (185,516) (66,853)
Funds receivable and customer accounts ................ (575,137) (336,875) 45,617
Other current assets ............................... (15,293) (105,186) (91,188)
Other non-current assets............................ 14,737 (89,866) 8,158
Accounts payable ................................ 32,986 36,954 14,946
Funds payable and amounts due to customers ............ 575,137 336,875 (45,617)
Accrued expenses and other liabilities ................. (75,189) (75,668) (220,591)
Deferred revenue and customer advances ............... 47,859 37,807 10,350
Income taxes payable and other tax liabilities ............ 329,772 151,459 197,555
Net cash provided by operating activities ................... 2,247,791 2,641,329 2,881,995
Cash flows from investing activities:
Purchases of property and equipment, net................. (515,448) (453,967) (565,890)
Principal loans receivable, net of collections .............. — — (106,508)
Purchases of investments ............................. (583,263) (270,676) (108,128)
Maturities and sales of investments ..................... 1,380,227 888,757 136,200
Acquisitions, net of cash acquired ...................... (45,505) (863,565) (1,360,293)
Other ........................................... (7,158) 6,305 (52,727)
Net cash provided by (used in) investing activities ............ 228,853 (693,146) (2,057,346)
Cash flows from financing activities:
Proceeds from issuance of common stock, net ............. 313,482 506,955 135,141
Repurchases of common stock, net ..................... (1,666,540) (1,485,397) (2,179,712)
Excess tax benefits from stock-based compensation ......... 92,371 84,830 4,701
Repayment of acquired line of credit .................... — — (433,981)
Net borrowings under credit agreement .................. — 200,000 800,000
Net cash used in financing activities ...................... (1,260,687) (693,612) (1,673,851)
Effect of exchange rate changes on cash and cash equivalents . . . 133,255 303,828 (183,061)
Net increase (decrease) in cash and cash equivalents .......... 1,349,212 1,558,399 (1,032,263)
Cash and cash equivalents at beginning of period ............. 1,313,580 2,662,792 4,221,191
Cash and cash equivalents at end of period ................. $2,
662,792 $ 4,221,191 $ 3,188,928
Supplemental cash flow disclosures:
Cash paid for interest ............................... $ 5,916 $ 10,474 $ 7,759
Cash paid for income taxes ........................... 179,169 363,047 366,824
Non-cash investing and financing activities:
Common stock options assumed pursuant to acquisition ...... — 10,361 92,092
Common stock issued for acquisition .................... 18,436 — —
The accompanying notes are an integral part of these consolidated financial statements.
80