eBay 2008 Annual Report Download - page 100
Download and view the complete annual report
Please find page 100 of the 2008 eBay annual report below. You can navigate through the pages in the report by either clicking on the pages listed below, or by using the keyword search tool below to find specific information within the annual report.-
 1
1 -
2
-
3
-
4
-
5
-
6
-
7
-
8
-
9
-
10
-
11
-
12
-
13
-
14
-
15
-
16
-
17
-
18
-
19
-
20
-
21
-
22
-
23
-
24
-
25
-
26
-
27
-
28
-
29
-
30
-
31
-
32
-
33
-
34
-
35
-
36
-
37
-
38
-
39
-
40
-
41
-
42
-
43
-
44
-
45
-
46
-
47
-
48
-
49
-
50
-
51
-
52
-
53
-
54
-
55
-
56
-
57
-
58
-
59
-
60
-
61
-
62
-
63
-
64
-
65
-
66
-
67
-
68
-
69
-
70
-
71
-
72
-
73
-
74
-
75
-
76
-
77
-
78
-
79
-
80
-
81
-
82
-
83
-
84
-
85
-
86
-
87
-
88
-
89
-
 90
90 -
 91
91 -
 92
92 -
 93
93 -
 94
94 -
 95
95 -
 96
96 -
 97
97 -
 98
98 -
 99
99 -
 100
100 -
 101
101 -
 102
102 -
 103
103 -
 104
104 -
 105
105 -
 106
106 -
 107
107 -
 108
108 -
 109
109 -
 110
110 -
111
-
112
-
113
-
114
-
115
-
116
-
117
-
118
-
119
-
120
-
121
-
122
-
123
-
124
 |
 |

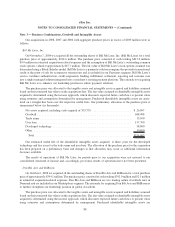
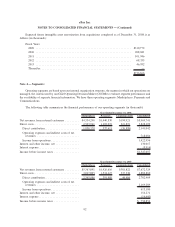
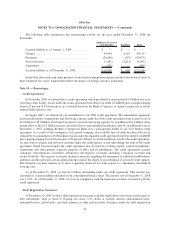
Expected future intangible asset amortization from acquisitions completed as of December 31, 2008 is as
follows (in thousands):
Fiscal Years:
2009 ............................................................. $310,772
2010 ............................................................. 208,681
2011 ............................................................. 101,946
2012 ............................................................. 68,335
2013 ............................................................. 46,932
Thereafter.......................................................... —
$736,666
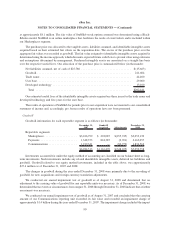
Note 4 — Segments:
Operating segments are based upon our internal organization structure, the manner in which our operations are
managed, the criteria used by our Chief Operating Decision Maker (CODM) to evaluate segment performance and
the availability of separate financial information. We have three operating segments: Marketplaces, Payments and
Communications.
The following table summarizes the financial performance of our operating segments (in thousands):
Marketplaces Payments Communications Consolidated
Year Ended December 31, 2006
Net revenues from external customers ......... $4,334,290 $1,440,530 $194,921 $5,969,741
Direct costs . ............................ 2,503,961 1,102,919 221,819 3,828,699
Direct contribution...................... 1,830,329 337,611 (26,898) 2,141,042
Operating expenses and indirect costs of net
revenues ........................... 718,086
Income from operations .................. 1,422,956
Interest and other income, net ............... 130,017
Interest expense.......................... (5,916)
Income before income taxes ................ $1,547,057
Marketplaces Payments Communications Consolidated
Year Ended December 31, 2007
Net revenues from external customers ......... $5,363,891 $1,926,616 $381,822 $7,672,329
Direct costs . ............................ 3,017,895 1,534,627 337,338 4,889,860
Direct contribution...................... 2,345,996 391,989 44,484 2,782,469
Operating expenses and indirect costs of net
revenues ........................... 2,169,289
Income from operations .................. 613,180
Interest and other income, net ............... 154,271
Interest expense.......................... (16,600)
Income before income taxes ................ $ 750,851
92
eBay Inc.
NOTES TO CONSOLIDATED FINANCIAL STATEMENTS — (Continued)