eBay 2008 Annual Report Download - page 63
Download and view the complete annual report
Please find page 63 of the 2008 eBay annual report below. You can navigate through the pages in the report by either clicking on the pages listed below, or by using the keyword search tool below to find specific information within the annual report.-
 1
1 -
2
-
3
-
4
-
5
-
6
-
7
-
8
-
9
-
10
-
11
-
12
-
13
-
14
-
15
-
16
-
17
-
18
-
19
-
20
-
21
-
22
-
23
-
24
-
25
-
26
-
27
-
28
-
29
-
30
-
31
-
32
-
33
-
34
-
35
-
36
-
37
-
38
-
39
-
40
-
41
-
42
-
43
-
44
-
45
-
46
-
47
-
48
-
49
-
50
-
51
-
52
-
 53
53 -
 54
54 -
 55
55 -
 56
56 -
 57
57 -
 58
58 -
 59
59 -
 60
60 -
 61
61 -
 62
62 -
 63
63 -
 64
64 -
 65
65 -
 66
66 -
 67
67 -
 68
68 -
 69
69 -
 70
70 -
 71
71 -
 72
72 -
 73
73 -
74
-
75
-
76
-
77
-
78
-
79
-
80
-
81
-
82
-
83
-
84
-
85
-
86
-
87
-
88
-
89
-
90
-
91
-
92
-
93
-
94
-
95
-
96
-
97
-
98
-
99
-
100
-
101
-
102
-
103
-
104
-
105
-
106
-
107
-
108
-
109
-
110
-
111
-
112
-
113
-
114
-
115
-
116
-
117
-
118
-
119
-
120
-
121
-
122
-
123
-
124
 |
 |

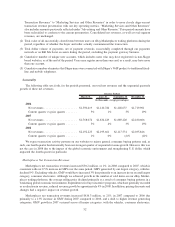
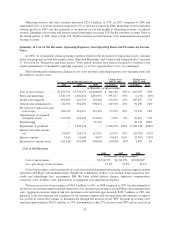
the proportion of customer transactions funded with credit cards, which have higher associated processing costs,
offset by a more favorable geographic mix and lower per transaction costs. Skype telecommunications costs
increased by $62.9 million, or 28%, due to the increase of SkypeOut minutes. Cost of net revenues increased as a
percentage of net revenues primarily as a result of the growth of our lower gross margin businesses, particularly
PayPal and Skype.
The increase in cost of net revenues of $506.2 million, or 40%, in 2007 compared to 2006 was due primarily to
an increase in payment processing costs, customer support and site operations costs and Skype telecommunications
costs. Payment processing costs increased approximately $200.1 million, or 40%, due primarily to the 33% increase
in PayPal’s net TPV, an increase in the proportion of customer transactions funded with credit cards, which have
higher associated processing costs, and increased Marketplaces transaction activity. Aggregate customer support
and site operations costs increased approximately $153.1 million, or 26%, due to the development and expansion of
our customer support and site operations infrastructure to support our growth in transaction volume as demonstrated
through the increases in both GMV and net TPV. Skype telecommunications costs increased by $86.2 million, or
64%, due to the increase of SkypeOut minutes. Cost of net revenues increased as a percentage of net revenues
primarily as a result of the growth of our lower gross margin businesses, particularly PayPal and Skype.
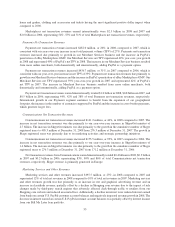
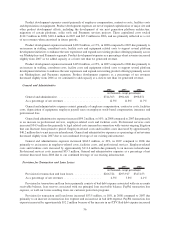
Sales and Marketing
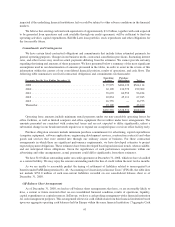
2006 2007 2008
(in thousands, except percentages)
Salesandmarketing............................. $1,587,133 $1,882,810 $1,881,551
As a percentage of net revenues .................... 26.6% 24.5% 22.0%
Sales and marketing expenses consist primarily of advertising costs, marketing programs and employee
compensation for sales and marketing staff.
Sales and marketing expenses decreased $1.3 million in 2008 compared to 2007 as we increased the use of
buyer and seller incentive programs (for which certain associated expenses are recorded as a reduction in revenue
instead of sales and marketing expense) as opposed to online and offline marketing programs as we shifted our
marketing focus from customer acquisition to customer retention. Marketing and advertising program costs
decreased approximately $100.4 million partially offset by an $87.7 million increase in employee-related costs due
to a net increase in staffing. Our marketing expenses are largely variable, based on growth in revenue and changes in
advertising rates. Sales and marketing expense as a percentage of net revenues decreased from 2007, due to more
efficient spending within our Marketplaces segment as we shifted the focus of our marketing programs, as well as
the growth of our Payments and Communications segments, each of which has a lower relative sales and marketing
expenses than our Marketplaces segment.
Sales and marketing expenses increased $295.7 million, or 19%, in 2007 compared to 2006, due to our
continued investment in retaining and growing our active user base. We direct customers to our websites primarily
through a number of online marketing channels such as sponsored search, portal advertising, email campaigns and
other initiatives. Growth in advertising and marketing costs, as well as employee-related costs, comprised the
majority of the increases. Combined advertising and marketing costs increased $222.5 million due to an increase in
global television and online marketing campaigns. Employee-related costs and the use of contractors increased by
$48.7 million as we continued to expand our domestic and international operations. Sales and marketing expense as
a percentage of net revenues decreased from 2006, due to more efficient spending within our Marketplaces segment
as we continued to refine our marketing programs and to the growth of our Payments and Communications
segments, each of which has lower relative sales and marketing expenses than our Marketplaces segment.
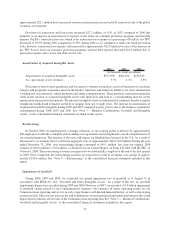
Product Development
2006 2007 2008
(in thousands, except percentages)
Product development ................................ $494,695 $619,727 $725,600
As a percentage of net revenues ........................ 8.3% 8.1% 8.5%
55