eBay 2008 Annual Report Download - page 55
Download and view the complete annual report
Please find page 55 of the 2008 eBay annual report below. You can navigate through the pages in the report by either clicking on the pages listed below, or by using the keyword search tool below to find specific information within the annual report.-
 1
1 -
2
-
3
-
4
-
5
-
6
-
7
-
8
-
9
-
10
-
11
-
12
-
13
-
14
-
15
-
16
-
17
-
18
-
19
-
20
-
21
-
22
-
23
-
24
-
25
-
26
-
27
-
28
-
29
-
30
-
31
-
32
-
33
-
34
-
35
-
36
-
37
-
38
-
39
-
40
-
41
-
42
-
43
-
44
-
 45
45 -
 46
46 -
 47
47 -
 48
48 -
 49
49 -
 50
50 -
 51
51 -
 52
52 -
 53
53 -
 54
54 -
 55
55 -
 56
56 -
 57
57 -
 58
58 -
 59
59 -
 60
60 -
 61
61 -
 62
62 -
 63
63 -
 64
64 -
 65
65 -
66
-
67
-
68
-
69
-
70
-
71
-
72
-
73
-
74
-
75
-
76
-
77
-
78
-
79
-
80
-
81
-
82
-
83
-
84
-
85
-
86
-
87
-
88
-
89
-
90
-
91
-
92
-
93
-
94
-
95
-
96
-
97
-
98
-
99
-
100
-
101
-
102
-
103
-
104
-
105
-
106
-
107
-
108
-
109
-
110
-
111
-
112
-
113
-
114
-
115
-
116
-
117
-
118
-
119
-
120
-
121
-
122
-
123
-
124
 |
 |

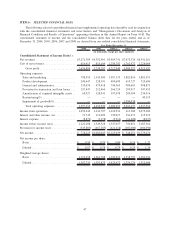
ITEM 6: SELECTED FINANCIAL DATA
The following selected consolidated financial and supplemental operating data should be read in conjunction
with the consolidated financial statements and notes thereto and “Management’s Discussion and Analysis of
Financial Condition and Results of Operations” appearing elsewhere in this Annual Report on Form 10-K. The
consolidated statement of income and the consolidated balance sheet data for the years ended, and as of,
December 31, 2004, 2005, 2006, 2007 and 2008 are derived from our audited consolidated financial statements.
2004 2005 2006(2) 2007(2) 2008(2)
Year Ended December 31,
(in thousands, except per share amounts)
Consolidated Statement of Income Data(1):
Net revenues ......................... $3,271,309 $4,552,401 $5,969,741 $7,672,329 $8,541,261
Cost of net revenues .................... 614,415 818,104 1,256,792 1,762,972 2,228,069
Grossprofit....................... 2,656,894 3,734,297 4,712,949 5,909,357 6,313,192
Operating expenses:
Salesandmarketing .................. 798,555 1,143,580 1,587,133 1,882,810 1,881,551
Product development .................. 240,647 328,191 494,695 619,727 725,600
General and administrative ............. 335,076 479,418 744,363 904,681 998,871
Provision for transaction and loan losses . . . 157,447 212,460 266,724 293,917 347,453
Amortization of acquired intangible assets . . 65,927 128,941 197,078 204,104 234,916
Restructuring(3) ..................... ————49,119
Impairment of goodwill(4).............. — — — 1,390,938 —
Total operating expenses ............. 1,597,652 2,292,590 3,289,993 5,296,177 4,237,510
Income from operations ................. 1,059,242 1,441,707 1,422,956 613,180 2,075,682
Interest and other income, net ............. 71,745 111,099 130,017 154,271 115,919
Interest expense ....................... (8,879) (3,478) (5,916) (16,600) (8,037)
Income before income taxes .............. 1,122,108 1,549,328 1,547,057 750,851 2,183,564
Provision for income taxes ............... (343,885) (467,285) (421,418) (402,600) (404,090)
Net income........................... $ 778,223 $1,082,043 $1,125,639 $ 348,251 $1,779,474
Net income per share:
Basic . ............................ $ 0.59 $ 0.79 $ 0.80 $ 0.26 $ 1.37
Diluted............................ $ 0.57 $ 0.78 $ 0.79 $ 0.25 $ 1.36
Weighted average shares:
Basic . ............................ 1,319,458 1,361,708 1,399,251 1,358,797 1,303,454
Diluted............................ 1,367,720 1,393,875 1,425,472 1,376,174 1,312,608
47