eBay 2008 Annual Report Download - page 59
Download and view the complete annual report
Please find page 59 of the 2008 eBay annual report below. You can navigate through the pages in the report by either clicking on the pages listed below, or by using the keyword search tool below to find specific information within the annual report.-
 1
1 -
2
-
3
-
4
-
5
-
6
-
7
-
8
-
9
-
10
-
11
-
12
-
13
-
14
-
15
-
16
-
17
-
18
-
19
-
20
-
21
-
22
-
23
-
24
-
25
-
26
-
27
-
28
-
29
-
30
-
31
-
32
-
33
-
34
-
35
-
36
-
37
-
38
-
39
-
40
-
41
-
42
-
43
-
44
-
45
-
46
-
47
-
48
-
 49
49 -
 50
50 -
 51
51 -
 52
52 -
 53
53 -
 54
54 -
 55
55 -
 56
56 -
 57
57 -
 58
58 -
 59
59 -
 60
60 -
 61
61 -
 62
62 -
 63
63 -
 64
64 -
 65
65 -
 66
66 -
 67
67 -
 68
68 -
 69
69 -
70
-
71
-
72
-
73
-
74
-
75
-
76
-
77
-
78
-
79
-
80
-
81
-
82
-
83
-
84
-
85
-
86
-
87
-
88
-
89
-
90
-
91
-
92
-
93
-
94
-
95
-
96
-
97
-
98
-
99
-
100
-
101
-
102
-
103
-
104
-
105
-
106
-
107
-
108
-
109
-
110
-
111
-
112
-
113
-
114
-
115
-
116
-
117
-
118
-
119
-
120
-
121
-
122
-
123
-
124
 |
 |

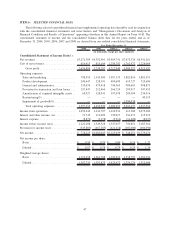
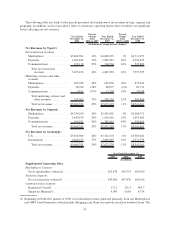
The following table sets forth, for the periods presented, the breakdown of net revenues by type, segment and
geography. In addition, we have provided a table of certain key operating metrics that we believe are significant
factors affecting our net revenues.
Year Ended
December 31,
2006
Percent
Change
from
2006 to 2007
Year Ended
December 31,
2007
Percent
Change
from
2007 to 2008
Year Ended
December 31,
2008
(in thousands, except percent changes)
Net Revenues by Type(1):
Net transaction revenues
Marketplaces ............... $3,864,502 21% $4,680,835 1% $4,711,057
Payments .................. 1,401,824 31% 1,838,539 26% 2,320,495
Communications ............. 189,110 93% 364,564 44% 525,803
Total net transaction
revenues ............... 5,455,436 26% 6,883,938 10% 7,557,355
Marketing services and other
revenues
Marketplaces ............... 469,788 45% 683,056 28% 875,694
Payments .................. 38,706 128% 88,077 (6)% 83,174
Communications ............. 5,811 197% 17,258 45% 25,038
Total marketing services and
other revenues ........... 514,305 53% 788,391 25% 983,906
Total net revenues .......... $5,969,741 29% $7,672,329 11% $8,541,261
Net Revenues by Segment:
Marketplaces ............... $4,334,290 24% $5,363,891 4% $5,586,751
Payments .................. 1,440,530 34% 1,926,616 25% 2,403,669
Communications ............. 194,921 96% 381,822 44% 550,841
Total net revenues .......... $5,969,741 29% $7,672,329 11% $8,541,261
Net Revenues by Geography:
U.S....................... $3,108,986 20% $3,742,670 6% $3,969,482
International ................ 2,860,755 37% 3,929,659 16% 4,571,779
Total net revenues .......... $5,969,741 29% $7,672,329 11% $8,541,261
2006 2007 2008
Year Ended December 31,
(in millions)
Supplemental Operating Data:
Marketplaces Segment:
Gross merchandise volume(2) ........................... $52,474 $59,353 $59,650
Payments Segment:
Net total payment volume(3) ........................... $35,800 $47,470 $60,146
Communications Segment:
Registered Users(4) .................................. 171.2 276.3 405.3
SkypeOut Minutes(5) ................................. 4,095 5,650 8,374
(1) Beginning with the first quarter of 2008, we reclassified revenue generated primarily from our Marketplaces
non-GMV based businesses (which include Shopping.com, Rent.com and our classified websites) from “Net
51