eBay 2008 Annual Report Download - page 60
Download and view the complete annual report
Please find page 60 of the 2008 eBay annual report below. You can navigate through the pages in the report by either clicking on the pages listed below, or by using the keyword search tool below to find specific information within the annual report.-
 1
1 -
2
-
3
-
4
-
5
-
6
-
7
-
8
-
9
-
10
-
11
-
12
-
13
-
14
-
15
-
16
-
17
-
18
-
19
-
20
-
21
-
22
-
23
-
24
-
25
-
26
-
27
-
28
-
29
-
30
-
31
-
32
-
33
-
34
-
35
-
36
-
37
-
38
-
39
-
40
-
41
-
42
-
43
-
44
-
45
-
46
-
47
-
48
-
49
-
 50
50 -
 51
51 -
 52
52 -
 53
53 -
 54
54 -
 55
55 -
 56
56 -
 57
57 -
 58
58 -
 59
59 -
 60
60 -
 61
61 -
 62
62 -
 63
63 -
 64
64 -
 65
65 -
 66
66 -
 67
67 -
 68
68 -
 69
69 -
 70
70 -
71
-
72
-
73
-
74
-
75
-
76
-
77
-
78
-
79
-
80
-
81
-
82
-
83
-
84
-
85
-
86
-
87
-
88
-
89
-
90
-
91
-
92
-
93
-
94
-
95
-
96
-
97
-
98
-
99
-
100
-
101
-
102
-
103
-
104
-
105
-
106
-
107
-
108
-
109
-
110
-
111
-
112
-
113
-
114
-
115
-
116
-
117
-
118
-
119
-
120
-
121
-
122
-
123
-
124
 |
 |

Transaction Revenues” to “Marketing Services and Other Revenues” in order to more closely align our net
transaction revenue presentation with our key operating metrics. “Marketing Services and Other Revenues”
also includes amounts previously reflected under “Advertising and Other Revenue.” Prior period amounts have
been reclassified to conform to the current presentation. Consolidated net revenues, as well as total segment
revenues, are unchanged.
(2) Total value of all successfully closed items between users on eBay Marketplaces trading platforms during the
period, regardless of whether the buyer and seller actually consummated the transaction.
(3) Total dollar volume of payments, net of payment reversals, successfully completed through our payments
network or on Bill Me Later accounts during the period, excluding the payment gateway business.
(4) Cumulative number of unique user accounts, which includes users who may have registered via non-Skype
based websites, as of the end of the period. Users may register more than once and, as a result, may have more
than one account.
(5) Cumulative number of minutes that Skype users were connected with Skype’s VoIP product to traditional fixed-
line and mobile telephones.
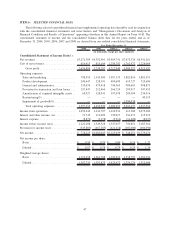
Seasonality
The following table sets forth, for the periods presented, our total net revenues and the sequential quarterly
growth of these net revenues.
March 31 June 30 September 30 December 31
Quarter Ended
(in thousands, except percentages)
2006
Net revenues ..................... $1,390,419 $1,410,784 $1,448,637 $1,719,901
Currentquartervspriorquarter ....... 5% 1% 3% 19%
2007
Net revenues ..................... $1,768,074 $1,834,429 $1,889,220 $2,180,606
Currentquartervspriorquarter ....... 3% 4% 3% 15%
2008
Net revenues ..................... $2,192,223 $2,195,661 $2,117,531 $2,035,846
Currentquartervspriorquarter ....... 1% 0% (4)% (4)%
We expect transaction activity patterns on our websites to mirror general consumer buying patterns and, as
such, our fourth quarter has historically been our strongest quarter of sequential revenue growth. However, this was
not the case in 2008 due to the impact of the global economic environment and strengthening U.S. dollar, which
impacted the fourth quarter in particular.
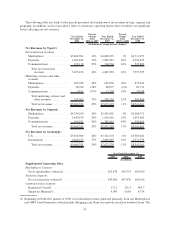
Marketplaces Net Transaction Revenues
Marketplaces net transaction revenues increased $30.2 million, or 1%, in 2008 compared to 2007, which is
consistent with our 0.5% increase in GMVover the same period. GMV generated by our largest category, vehicles,
declined 9%. Excluding vehicles, GMV would have increased 3% due primarily to an increase in our second largest
category, consumer electronics. Although we achieved growth in the number of sold items on our eBay Market-
places trading platforms, the average selling price declined primarily as a result of consumer buying patterns in a
weakening global economic environment. Expenditures for buyer incentive programs, which are generally recorded
as a reduction in revenue, reduced revenue growth by approximately 4% in 2008. In addition, pricing discounts and
changes had a negative impact on revenue growth.
Marketplaces net transaction revenues increased $816.3 million, or 21%, in 2007 compared to 2006 due
primarily to a 13% increase in GMV during 2007 compared to 2006, and a shift to higher revenue generating
categories. GMV growth in 2007 occurred across all major categories, with the vehicles, consumer electronics,
52