eBay 2008 Annual Report Download - page 62
Download and view the complete annual report
Please find page 62 of the 2008 eBay annual report below. You can navigate through the pages in the report by either clicking on the pages listed below, or by using the keyword search tool below to find specific information within the annual report.-
 1
1 -
2
-
3
-
4
-
5
-
6
-
7
-
8
-
9
-
10
-
11
-
12
-
13
-
14
-
15
-
16
-
17
-
18
-
19
-
20
-
21
-
22
-
23
-
24
-
25
-
26
-
27
-
28
-
29
-
30
-
31
-
32
-
33
-
34
-
35
-
36
-
37
-
38
-
39
-
40
-
41
-
42
-
43
-
44
-
45
-
46
-
47
-
48
-
49
-
50
-
51
-
 52
52 -
 53
53 -
 54
54 -
 55
55 -
 56
56 -
 57
57 -
 58
58 -
 59
59 -
 60
60 -
 61
61 -
 62
62 -
 63
63 -
 64
64 -
 65
65 -
 66
66 -
 67
67 -
 68
68 -
 69
69 -
 70
70 -
 71
71 -
 72
72 -
73
-
74
-
75
-
76
-
77
-
78
-
79
-
80
-
81
-
82
-
83
-
84
-
85
-
86
-
87
-
88
-
89
-
90
-
91
-
92
-
93
-
94
-
95
-
96
-
97
-
98
-
99
-
100
-
101
-
102
-
103
-
104
-
105
-
106
-
107
-
108
-
109
-
110
-
111
-
112
-
113
-
114
-
115
-
116
-
117
-
118
-
119
-
120
-
121
-
122
-
123
-
124
 |
 |

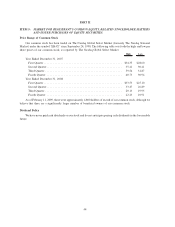
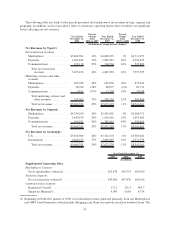
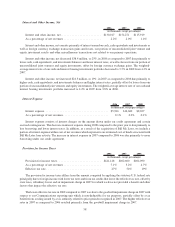
Marketing services and other revenues increased $274.1 million, or 53%, in 2007 compared to 2006 and
represented 10% of total net revenues compared to 9% of total net revenues in 2006. Marketing services and other
revenue growth in 2007 was due primarily to an increase in text and graphical advertising revenue, classifieds
revenue, Shopping.com revenue and interest earned from banks on certain U.S. PayPal customer accounts. Prior to
the fourth quarter of 2006, these certain U.S. PayPal customer account balances were maintained in non-interest
bearing accounts.
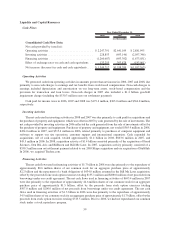
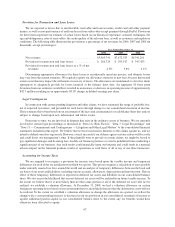
Summary of Cost of Net Revenues, Operating Expenses, Non-Operating Items and Provision for Income
Taxes
In 2008, we reclassified certain operating expenses related to the provision for transaction losses, customer
protection programs and bad debt expense from “Sales and Marketing” and “General and Administrative” expenses
to “Provision for Transaction and Loan Losses.” Prior period amounts have been reclassified to conform to the
current presentation. Consolidated operating expenses, as well as segment direct costs, are unchanged.
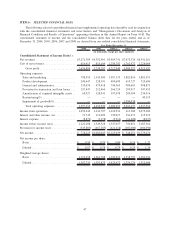
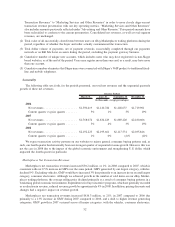
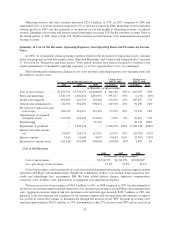
The following table summarizes changes in cost of net revenues, operating expenses, non-operating items and
provision for income taxes:
2006 2007 2008 in Dollars in % in Dollars in %
Year Ended December 31,
Change from
2006 to 2007
Change from
2007 to 2008
(in thousands, except percentages)
Cost of net revenues ....... $1,256,792 $1,762,972 $2,228,069 $ 506,180 40% $ 465,097 26%
Sales and marketing ....... 1,587,133 1,882,810 1,881,551 295,677 19% (1,259) (0)%
Product development....... 494,695 619,727 725,600 125,032 25% 105,873 17%
General and administrative . . 744,363 904,681 998,871 160,318 22% 94,190 10%
Provision for transaction and
loan losses ............ 266,724 293,917 347,453 27,193 10% 53,536 18%
Amortization of acquired
intangible assets ........ 197,078 204,104 234,916 7,026 4% 30,812 15%
Restructuring ............ — — 49,119 — — 49,119 100%
Impairment of goodwill .... — 1,390,938 — 1,390,938 100% (1,390,938) (100)%
Interest and other income,
net.................. 130,017 154,271 115,919 24,254 19% (38,352) (25)%
Interest expense . . ........ 5,916 16,600 8,037 10,684 181% (8,563) (52)%
Provision for income taxes . . 421,418 402,600 404,090 (18,818) (4)% 1,490 0%
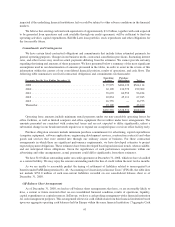
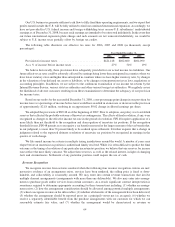
Cost of Net Revenues
2006 2007 2008
(in thousands, except percentages)
Cost of net revenues............................. $1,256,792 $1,762,972 $2,228,069
As a percentage of net revenues .................... 21.1% 23.0% 26.1%
Cost of net revenues consists primarily of costs associated with payment processing, customer support and site
operations and Skype telecommunications. Significant components of these costs include bank transaction fees,
credit card interchange fees, assessments, Bill Me Later related interest charges, employee compensation,
contractor costs, facilities costs, depreciation of equipment and amortization expense.
The increase in cost of net revenues of $465.1 million, or 26%, in 2008 compared to 2007 was due primarily to
an increase in customer support and site operations costs, payment processing costs and Skype telecommunication
costs. Aggregate customer support and site operations costs increased approximately $205.7 million, or 28%, due
primarily to the development and expansion of our customer support and site operations infrastructure to support
our growth in transaction volume as demonstrated through the increase in net TPV. Payment processing costs
increased approximately $165.2 million, or 24%, due primarily to the 27% increase in net TPV and an increase in
54