WeightWatchers 2012 Annual Report Download - page 72
Download and view the complete annual report
Please find page 72 of the 2012 WeightWatchers annual report below. You can navigate through the pages in the report by either clicking on the pages listed below, or by using the keyword search tool below to find specific information within the annual report.-
 1
1 -
2
-
3
-
4
-
5
-
6
-
7
-
8
-
9
-
10
-
11
-
12
-
13
-
14
-
15
-
16
-
17
-
18
-
19
-
20
-
21
-
22
-
23
-
24
-
25
-
26
-
27
-
28
-
29
-
30
-
31
-
32
-
33
-
34
-
35
-
36
-
37
-
38
-
39
-
40
-
41
-
42
-
43
-
44
-
45
-
46
-
47
-
48
-
49
-
50
-
51
-
52
-
53
-
54
-
55
-
56
-
57
-
58
-
59
-
60
-
61
-
 62
62 -
 63
63 -
 64
64 -
 65
65 -
 66
66 -
 67
67 -
 68
68 -
 69
69 -
 70
70 -
 71
71 -
 72
72 -
 73
73 -
 74
74 -
 75
75 -
 76
76 -
 77
77 -
 78
78 -
 79
79 -
 80
80 -
 81
81 -
 82
82 -
83
-
84
-
85
-
86
-
87
-
88
-
89
-
90
-
91
-
92
-
93
-
94
-
95
-
96
-
97
-
98
-
99
-
100
-
101
-
102
-
103
-
104
-
105
-
106
-
107
-
108
-
109
-
110
-
111
-
112
-
113
-
114
-
115
-
116
-
117
-
118
-
119
-
120
-
121
-
122
-
123
-
124
-
125
-
126
-
127
-
128
-
129
-
130
-
131
-
132
 |
 |

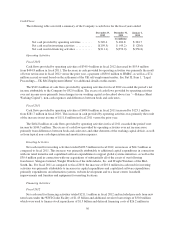
Cash Flows
The following table sets forth a summary of the Company’s cash flows for the fiscal years ended:
December 29,
2012
December 31,
2011
January 1,
2011
(in millions)
Net cash provided by operating activities ....... $349.4 $ 404.8 $ 281.7
Net cash used in investing activities ........... $(109.5) $ (45.2) $ (28.6)
Net cash used in financing activities ........... $(211.1) $(352.0) $(256.8)
Operating Activities
Fiscal 2012
Cash flows provided by operating activities of $349.4 million in fiscal 2012 decreased by $55.4 million
from $404.8 million in fiscal 2011. The decrease in cash provided by operating activities was primarily the result
of lower net income in fiscal 2012 versus the prior year, a payment of $30.0 million to HMRC, as well as a $7.4
million accrual reversal based on the settlement of the UK self-employment matter. See Part II, Item 1. “Legal
Proceedings—UK Self-Employment Matter” for additional details on this matter.
The $349.4 million of cash flows provided by operating activities for fiscal 2012 exceeded the period’s net
income attributable to the Company by $92.0 million. The excess of cash flows provided by operating activities
over net income arose primarily from changes in our working capital as described above (see “—Balance Sheet
Working Capital”), non-cash expenses and differences between book and cash taxes.
Fiscal 2011
Cash flows provided by operating activities of $404.8 million in fiscal 2011 increased by $123.1 million
from $281.7 million in fiscal 2010. This increase in cash provided by operating activities was primarily the result
of the increase in net income of $111.8 million in fiscal 2011 versus the prior year.
The $404.8 million of cash flows provided by operating activities in fiscal 2011 exceeded the period’s net
income by $100.5 million. The excess of cash flows provided by operating activities over net income arose
primarily from differences between book and cash taxes and other elements of the working capital deficit, as well
as from typical non-cash depreciation and amortization expenses.
Investing Activities
Net cash used for investing activities totaled $109.5 million in fiscal 2012, an increase of $64.3 million as
compared to fiscal 2011. This increase was primarily attributable to additional capital expenditures in connection
with our retail initiative and capitalized software expenditures to support global systems initiatives, as well as the
$30.4 million paid in connection with our acquisitions of substantially all of the assets of our following
franchisees: Slengora Limited, Weight Watchers of the Adirondacks, Inc. and Weight Watchers of the Mid-
South, Inc. For fiscal 2011 as compared to fiscal 2010, the increase of $16.6 million in cash used for investing
activities was primarily attributable to increases in capital expenditures and capitalized software expenditures,
primarily expenditures on information systems, website development and to a lesser extent, leasehold
improvements and furniture and equipment for meeting locations.
Financing Activities
Fiscal 2012
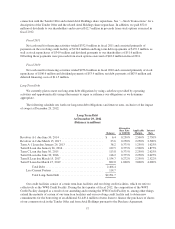
Net cash used for financing activities totaled $211.1 million in fiscal 2012 and included proceeds from new
term loans under the WWI Credit Facility of $1.45 billion and additional revolver borrowings of $30.0 million
which were used to finance stock repurchases of $1.5 billion and deferred financing costs of $26.2 million in
56