WeightWatchers 2012 Annual Report Download - page 68
Download and view the complete annual report
Please find page 68 of the 2012 WeightWatchers annual report below. You can navigate through the pages in the report by either clicking on the pages listed below, or by using the keyword search tool below to find specific information within the annual report.-
 1
1 -
2
-
3
-
4
-
5
-
6
-
7
-
8
-
9
-
10
-
11
-
12
-
13
-
14
-
15
-
16
-
17
-
18
-
19
-
20
-
21
-
22
-
23
-
24
-
25
-
26
-
27
-
28
-
29
-
30
-
31
-
32
-
33
-
34
-
35
-
36
-
37
-
38
-
39
-
40
-
41
-
42
-
43
-
44
-
45
-
46
-
47
-
48
-
49
-
50
-
51
-
52
-
53
-
54
-
55
-
56
-
57
-
 58
58 -
 59
59 -
 60
60 -
 61
61 -
 62
62 -
 63
63 -
 64
64 -
 65
65 -
 66
66 -
 67
67 -
 68
68 -
 69
69 -
 70
70 -
 71
71 -
 72
72 -
 73
73 -
 74
74 -
 75
75 -
 76
76 -
 77
77 -
 78
78 -
79
-
80
-
81
-
82
-
83
-
84
-
85
-
86
-
87
-
88
-
89
-
90
-
91
-
92
-
93
-
94
-
95
-
96
-
97
-
98
-
99
-
100
-
101
-
102
-
103
-
104
-
105
-
106
-
107
-
108
-
109
-
110
-
111
-
112
-
113
-
114
-
115
-
116
-
117
-
118
-
119
-
120
-
121
-
122
-
123
-
124
-
125
-
126
-
127
-
128
-
129
-
130
-
131
-
132
 |
 |
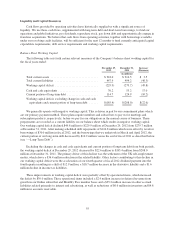
quarter fiscal 2011, due to cycling against the very successful launch of the program innovation in November of
2010, paid weeks and attendance growth of 15.0% and 5.5% decelerated when compared to the paid weeks and
attendance growth of 30.2% and 22.7% we experienced in the first nine months of fiscal 2011 as compared to the
respective prior year periods.
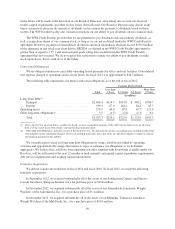
Our international meeting fees in fiscal 2011 were $303.5 million, an increase of $29.1 million, or 10.6%,
from $274.4 million in the prior year. After the $2.0 million adjustment to fiscal 2010 international meeting fees
for the UK VAT accrual reversal noted above, fiscal 2011 revenues would have been $31.2 million or 11.5%
above fiscal 2010. Excluding the impact of foreign currency, which increased adjusted international meeting fees
by $17.4 million, adjusted international meeting fees grew by 5.1% in fiscal 2011 versus the prior year.
International meeting paid weeks increased 7.0% versus the prior year to 34.9 million in fiscal 2011, driven
primarily by the performance of the UK meetings business. International attendance increased by 1.6%, to
21.0 million in fiscal 2011 versus 20.7 million in fiscal 2010, primarily as a result of declines in the Continental
European meetings business.
The UK meetings business benefited from the impact of the ProPoints program, which launched in late
fiscal 2010 and drove meeting fees and paid weeks growth in that market. UK meeting fees in fiscal 2011 grew
by 23.5%, or 18.7% on a constant currency basis, with paid weeks up 18.3% and attendance up 13.7% in fiscal
2011, as compared to the prior year. After the $2.0 million adjustment to fiscal 2010 international meeting fees
for the UK VAT accrual reversal noted above, fiscal 2011 revenues would have been $24.6 million, or 26.2%,
above fiscal 2010.
The growth in the UK meetings business was partially offset by declining meeting fees and paid weeks
volume in the period in Continental Europe, which was cycling against a year earlier, less successful program
launch, and which has not yet developed sufficiently effective marketing campaigns. Continental European
meeting fees in fiscal 2011 decreased by 4.7%, or 10.0% on a constant currency basis, as compared to the prior
year, with paid weeks declining 9.8% and attendance declining 15.4% in the period.
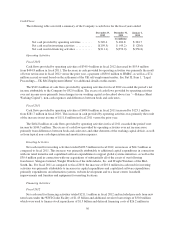
In-Meeting Product Sales
Global in-meeting product sales in fiscal 2011 were $281.8 million, an increase of $21.3 million, or 8.2%,
from $260.5 million in fiscal 2010. Excluding the impact of foreign currency, which increased in-meeting
product sales by $6.9 million, global in-meeting product sales rose 5.6% in fiscal 2011 versus the prior year on
the strength of higher attendance volumes. On a per attendee basis, global in-meeting product sales decreased
3.3%, or 5.6% on a constant currency basis, in fiscal 2011 versus the prior year. This decline was primarily the
result of lower sales of consumable products, partially offset by higher sales of enrollment products.
In NACO, in-meeting product sales of $157.9 million in fiscal 2011 increased by $19.1 million, or 13.8%,
versus the prior year, on the strength of higher attendance volumes. NACO’s in-meeting product sales per
attendee decreased 4.2%, or 4.5% on a constant currency basis, versus the prior year. International in-meeting
product sales were $123.9 million in fiscal 2011, an increase of 1.8%, but declined 3.5% on a constant currency
basis, versus the prior year. On a per attendee basis, international product sales increased 0.2%, but declined
5.0% on a constant currency basis, versus the prior year.
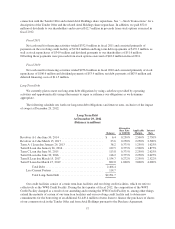
Internet Revenues
Internet revenues, which include subscription revenues from sales of Weight Watchers Online and Weight
Watchers eTools as well as Internet advertising revenues, increased significantly, up $160.7 million, or 67.3%, to
$399.5 million for fiscal 2011 from $238.8 million for fiscal 2010. Excluding the impact of foreign currency,
which increased Internet revenues by $5.5 million, Internet revenues grew by 65.0% in fiscal 2011 versus the
prior year. We entered fiscal 2011 with an active Online subscriber base that was 38.2% higher than at the
beginning of fiscal 2010, and ended fiscal 2011 with approximately 1.6 million end of period active Online
52