WeightWatchers 2012 Annual Report Download - page 49
Download and view the complete annual report
Please find page 49 of the 2012 WeightWatchers annual report below. You can navigate through the pages in the report by either clicking on the pages listed below, or by using the keyword search tool below to find specific information within the annual report.-
 1
1 -
2
-
3
-
4
-
5
-
6
-
7
-
8
-
9
-
10
-
11
-
12
-
13
-
14
-
15
-
16
-
17
-
18
-
19
-
20
-
21
-
22
-
23
-
24
-
25
-
26
-
27
-
28
-
29
-
30
-
31
-
32
-
33
-
34
-
35
-
36
-
37
-
38
-
 39
39 -
 40
40 -
 41
41 -
 42
42 -
 43
43 -
 44
44 -
 45
45 -
 46
46 -
 47
47 -
 48
48 -
 49
49 -
 50
50 -
 51
51 -
 52
52 -
 53
53 -
 54
54 -
 55
55 -
 56
56 -
 57
57 -
 58
58 -
 59
59 -
60
-
61
-
62
-
63
-
64
-
65
-
66
-
67
-
68
-
69
-
70
-
71
-
72
-
73
-
74
-
75
-
76
-
77
-
78
-
79
-
80
-
81
-
82
-
83
-
84
-
85
-
86
-
87
-
88
-
89
-
90
-
91
-
92
-
93
-
94
-
95
-
96
-
97
-
98
-
99
-
100
-
101
-
102
-
103
-
104
-
105
-
106
-
107
-
108
-
109
-
110
-
111
-
112
-
113
-
114
-
115
-
116
-
117
-
118
-
119
-
120
-
121
-
122
-
123
-
124
-
125
-
126
-
127
-
128
-
129
-
130
-
131
-
132
 |
 |

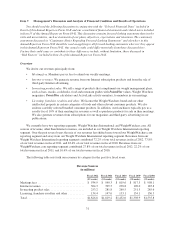
Metrics and Business Trends
Performance Indicators and Market Trends
Our management reviews and analyzes several key performance indicators in order to manage our business
and assess the quality and potential variability of our cash flows and earnings. These key performance indicators
include:
• net revenues;
• paid weeks and attendance metrics;
• lecture income per paid week and in-meeting product sales per attendee;
• the number of end of period active Online subscribers; and
• gross profit and operating expenses as a percentage of revenue.
We believe that our revenues and profitability can be sensitive to major trends in the weight management
industry. In particular, we believe that our business could be adversely impacted by:
• the temporary emergence of fad diets;
• increased competition from Internet, mobile and other electronic weight management approaches;
• a decrease in the effectiveness of our marketing and advertising programs;
• a failure to develop innovative new services and products;
• the development of more favorably perceived or more effective weight management methods,
including pharmaceuticals;
• an impairment of the Weight Watchers brand and our other intellectual property;
• a failure of our technology or systems to perform as designed; and
• a downturn in general economic conditions or consumer confidence.
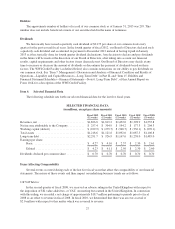
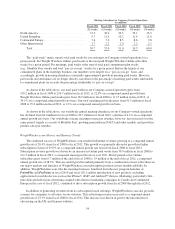
Global Operations
The following tables set forth our paid weeks and meeting attendance by geography for the past five fiscal
years:
Paid Weeks in Company-Owned Operations
(in millions)
Fiscal 2012 Fiscal 2011 Fiscal 2010 Fiscal 2009 Fiscal 2008
(52 weeks) (52 weeks) (52 weeks) (52 weeks) (53 weeks)
Online Paid Weeks ........................... 111.5 88.0 52.5 42.7 38.9
Meeting Paid Weeks:
North America ........................... 66.0 69.9 55.3 55.8 61.0
United Kingdom ......................... 16.9 19.1 16.1 16.2 15.0
Continental Europe ....................... 13.4 12.2 13.6 12.7 12.5
Other International ....................... 2.9 3.6 2.9 2.9 2.8
Total Meeting Paid Weeks ..................... 99.2 104.8 87.9 87.6 91.3
Total Paid Weeks ..................... 210.7 192.8 140.4 130.3 130.2
33