WeightWatchers 2012 Annual Report Download - page 54
Download and view the complete annual report
Please find page 54 of the 2012 WeightWatchers annual report below. You can navigate through the pages in the report by either clicking on the pages listed below, or by using the keyword search tool below to find specific information within the annual report.-
 1
1 -
2
-
3
-
4
-
5
-
6
-
7
-
8
-
9
-
10
-
11
-
12
-
13
-
14
-
15
-
16
-
17
-
18
-
19
-
20
-
21
-
22
-
23
-
24
-
25
-
26
-
27
-
28
-
29
-
30
-
31
-
32
-
33
-
34
-
35
-
36
-
37
-
38
-
39
-
40
-
41
-
42
-
43
-
 44
44 -
 45
45 -
 46
46 -
 47
47 -
 48
48 -
 49
49 -
 50
50 -
 51
51 -
 52
52 -
 53
53 -
 54
54 -
 55
55 -
 56
56 -
 57
57 -
 58
58 -
 59
59 -
 60
60 -
 61
61 -
 62
62 -
 63
63 -
 64
64 -
65
-
66
-
67
-
68
-
69
-
70
-
71
-
72
-
73
-
74
-
75
-
76
-
77
-
78
-
79
-
80
-
81
-
82
-
83
-
84
-
85
-
86
-
87
-
88
-
89
-
90
-
91
-
92
-
93
-
94
-
95
-
96
-
97
-
98
-
99
-
100
-
101
-
102
-
103
-
104
-
105
-
106
-
107
-
108
-
109
-
110
-
111
-
112
-
113
-
114
-
115
-
116
-
117
-
118
-
119
-
120
-
121
-
122
-
123
-
124
-
125
-
126
-
127
-
128
-
129
-
130
-
131
-
132
 |
 |

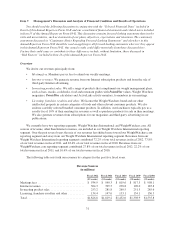
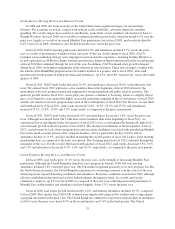
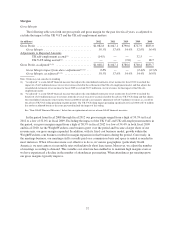
Operating Margin
The following table sets forth our Operating Income for the past five fiscal years, as adjusted to exclude the
impact of the UK VAT and UK self-employment matters as well as the previously reported impact of
restructuring charges:
(in millions) 2012 2011 2010 2009 2008
Operating Income .................................... $510.8 $546.3 $390.3 $356.7 $425.0
Operating Income Margin ......................... 28.0% 30.0% 26.9% 25.5% 27.7%
Adjustments to Reported Amounts
UK Self-employment accrual(1) ................. (14.5) — — 32.5 —
UK VAT ruling accrual(2) ...................... — — (2.0) — 18.7
Restructuring charges(1) ....................... — — — 5.5 —
Operating Income, as adjusted(1)(2) ....................... $496.3 $546.3 $388.3 $394.6 $443.7
Operating Income Margin impact from above
adjustments(1)(2) ................................ 0.8% — 0.1% (2.7)% (0.8)%
Operating Income Margin, as adjusted(1)(2) ............ 27.2% 30.0% 26.8% 28.2% 28.5%
Note: Totals may not sum due to rounding
(1) “As adjusted” is a non-GAAP financial measure that adjusts the consolidated statements of income for fiscal 2012 to exclude the impact
of a $14.5 million decrease to cost of revenues related to the settlement of the UK self-employment matter and that adjusts the
consolidated statements of income for fiscal 2009 to exclude $32.5 million in cost of revenues for the impact of the UK self-employment
matter and the $5.5 million impact of restructuring charges.
(2) “As adjusted” is a non-GAAP financial measure that adjusts the consolidated statements of net income for fiscal 2010 to exclude the
benefit of a $2.0 million increase to revenues from the reversal of an over-accrual related to the adverse UK VAT ruling and that adjusts
the consolidated statements of net income for fiscal 2008 to include a net negative adjustment of $18.7 million to revenues as a result of
the adverse UK VAT ruling pertaining to prior periods. The UK VAT ruling impact pertaining specifically to fiscal 2008 of $7.8 million
has not been adjusted herein as the years presented include the impact of this ruling.
See “Non-GAAP Financial Measures” below for an explanation of our use of non-GAAP financial measures.
In the period from fiscal 2008 through fiscal 2012 our operating income margin ranged from a high of
30.0% in fiscal 2011 to a low of 25.5% in fiscal 2009. Excluding the impact of the UK VAT and UK self-
employment matters and the impact of our previously reported restructuring charges in the period, our operating
income margin ranged from a high of 30.0% in fiscal 2011 to a low of 26.8% in fiscal 2010. In fiscal 2010, the
operating income margin of the Company was driven by significant investment for the preparation and launch of
the PointsPlus program in the United States and Canada and ProPoints program in the United Kingdom and
Australia, increased marketing for our WeightWatchers.com business, and a charge associated with the
settlement of a California labor litigation.
In fiscal 2011, the operating income margin of the Company was 30.0%, the highest in the five-year period.
This was despite the increased marketing in WeightWatchers.com stemming from the initiative focused on
building awareness and relevance of the Weight Watchers brand with the male demographic, as well as expenses
in support of growth initiatives, including technology for the development of our mobile platforms and additions
to staff in support of business development. These higher expenses were more than offset by the efficiencies we
gained from higher average attendance in our meetings and the impact of the higher margin
WeightWatchers.com business becoming a larger component of our revenue mix.
In fiscal 2012, excluding the impact of the UK self-employment matter, operating income declined to 27.2%
from 30.0% in the prior year. This decline in operating income margin was primarily driven by costs related to
first time Online TV marketing campaigns in several of our international markets and our significant investment
in marketing the Weight Watchers Online product to men in the United States, as well as, selling, general and
administrative expenses in support of our growth initiatives.
38