WeightWatchers 2012 Annual Report Download - page 59
Download and view the complete annual report
Please find page 59 of the 2012 WeightWatchers annual report below. You can navigate through the pages in the report by either clicking on the pages listed below, or by using the keyword search tool below to find specific information within the annual report.-
 1
1 -
2
-
3
-
4
-
5
-
6
-
7
-
8
-
9
-
10
-
11
-
12
-
13
-
14
-
15
-
16
-
17
-
18
-
19
-
20
-
21
-
22
-
23
-
24
-
25
-
26
-
27
-
28
-
29
-
30
-
31
-
32
-
33
-
34
-
35
-
36
-
37
-
38
-
39
-
40
-
41
-
42
-
43
-
44
-
45
-
46
-
47
-
48
-
 49
49 -
 50
50 -
 51
51 -
 52
52 -
 53
53 -
 54
54 -
 55
55 -
 56
56 -
 57
57 -
 58
58 -
 59
59 -
 60
60 -
 61
61 -
 62
62 -
 63
63 -
 64
64 -
 65
65 -
 66
66 -
 67
67 -
 68
68 -
 69
69 -
70
-
71
-
72
-
73
-
74
-
75
-
76
-
77
-
78
-
79
-
80
-
81
-
82
-
83
-
84
-
85
-
86
-
87
-
88
-
89
-
90
-
91
-
92
-
93
-
94
-
95
-
96
-
97
-
98
-
99
-
100
-
101
-
102
-
103
-
104
-
105
-
106
-
107
-
108
-
109
-
110
-
111
-
112
-
113
-
114
-
115
-
116
-
117
-
118
-
119
-
120
-
121
-
122
-
123
-
124
-
125
-
126
-
127
-
128
-
129
-
130
-
131
-
132
 |
 |

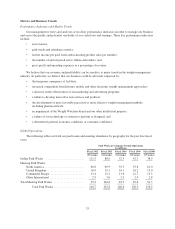
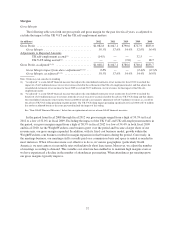
Summary of Selected Financial Data as Reported and Adjusted
(In millions, except per share amounts)
Fiscal
2012
Fiscal
2011
Increase/
(Decrease)
%
Change
Revenues ............................................. $1,826.8 $1,819.2 $ 7.7 0.4%
Cost of revenues (as adjusted)(1) ........................... 758.6 772.0 (13.4) (1.7%)
UK Self-employment settlement(1) ..................... (14.5) — (14.5)
Cost of revenues ....................................... 744.0 772.0 (28.0) (3.6%)
Gross Profit ................................... 1,082.8 1,047.1 35.6 3.4%
Gross Margin % ............................... 59.3% 57.6%
Marketing expenses ..................................... 343.5 292.4 51.2 17.5%
Selling, general & administrative expenses .................. 228.5 208.5 20.0 9.6%
Operating income .............................. 510.8 546.3 (35.5) (6.5%)
Operating Income Margin % ..................... 28.0% 30.0%
Interest expense (as adjusted)(1) ............................ 83.4 59.9 23.6 39.4%
UK Self-employment settlement(1) ..................... 7.1 — 7.1
Interest expense ........................................ 90.5 59.9 30.7 51.3%
Other expense, net ...................................... 2.0 3.4 (1.4) (41.6%)
Early extinguishment of debt ............................. 1.3 — 1.3
Income before income taxes ...................... 417.0 483.1 (66.1) (13.7%)
Provision for income taxes (as adjusted)(1) ................... 156.2 178.7 (22.5) (12.6%)
UK Self-employment settlement(1) ..................... 3.3 — 3.3
Provision for income taxes ............................... 159.5 178.7 (19.2) (10.7%)
Net income ................................... 257.4 304.3 (46.9) (15.4%)
Net loss attributable to the noncontrolling interest ............. — 0.5 (0.5)
Net income attributable to the Company ............ $ 257.4 $ 304.9 $(47.4) (15.6%)
Weighted average diluted shares outstanding ................. 60.9 74.1 (13.2) (17.8%)
Diluted EPS ........................................... $ 4.23 $ 4.11 $ 0.11 2.7%
Note: Totals may not sum due to rounding
(1) “As adjusted” is a non-GAAP financial measure that adjusts the consolidated statements of income for fiscal 2012 to exclude the impact
of a $14.5 million decrease to cost of revenues and $7.1 million increase to interest expense related to the settlement of the UK Self-
employment matter. See “Non-GAAP Financial Measures” above for an explanation of our use of non-GAAP financial measures.
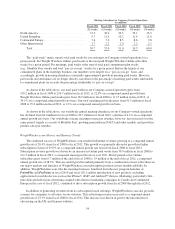
The following table sets forth a reconciliation for fiscal 2012 of certain selected financial data:
(in millions, except per share amounts)
Gross
Profit
Gross
Profit
Margin
Operating
Income
Operating
Income
Margin
Interest
Expense
Net Income
Attributable
to Company
Diluted
EPS
Fiscal 2012 ...................... $1,082.8 59.3% $510.8 28.0% $90.5 $257.4 $ 4.23
Adjustments to Reported Amounts(1)
UK self-employment accrual
reversal(1) ................. (14.5) (14.5) (7.1) (4.1) (0.07)
Total Adjustments ........ (14.5) (14.5) (7.1) (4.1) (0.07)
Fiscal 2012, as adjusted(1) .......... $1,068.2 58.5% $496.3 27.2% $83.4 $253.3 $ 4.16
Note: Totals may not sum due to rounding
(1) “As adjusted” is a non-GAAP financial measure that adjusts the consolidated statements of net income for fiscal 2012 to exclude the
impact of a $14.5 million decrease to cost of revenues and the $7.1 million increase to interest expense related to the settlement of the
UK self-employment matter .
See “Non-GAAP Financial Measures” above for an explanation of our use of non-GAAP financial measures.
43