WeightWatchers 2012 Annual Report Download - page 61
Download and view the complete annual report
Please find page 61 of the 2012 WeightWatchers annual report below. You can navigate through the pages in the report by either clicking on the pages listed below, or by using the keyword search tool below to find specific information within the annual report.-
 1
1 -
2
-
3
-
4
-
5
-
6
-
7
-
8
-
9
-
10
-
11
-
12
-
13
-
14
-
15
-
16
-
17
-
18
-
19
-
20
-
21
-
22
-
23
-
24
-
25
-
26
-
27
-
28
-
29
-
30
-
31
-
32
-
33
-
34
-
35
-
36
-
37
-
38
-
39
-
40
-
41
-
42
-
43
-
44
-
45
-
46
-
47
-
48
-
49
-
50
-
 51
51 -
 52
52 -
 53
53 -
 54
54 -
 55
55 -
 56
56 -
 57
57 -
 58
58 -
 59
59 -
 60
60 -
 61
61 -
 62
62 -
 63
63 -
 64
64 -
 65
65 -
 66
66 -
 67
67 -
 68
68 -
 69
69 -
 70
70 -
 71
71 -
72
-
73
-
74
-
75
-
76
-
77
-
78
-
79
-
80
-
81
-
82
-
83
-
84
-
85
-
86
-
87
-
88
-
89
-
90
-
91
-
92
-
93
-
94
-
95
-
96
-
97
-
98
-
99
-
100
-
101
-
102
-
103
-
104
-
105
-
106
-
107
-
108
-
109
-
110
-
111
-
112
-
113
-
114
-
115
-
116
-
117
-
118
-
119
-
120
-
121
-
122
-
123
-
124
-
125
-
126
-
127
-
128
-
129
-
130
-
131
-
132
 |
 |
the first quarter of fiscal 2012, benefited from our repurchase of shares in the Tender Offer and the related share
repurchase from Artal Holdings as our weighted average diluted shares outstanding for fiscal 2012 decreased to
60.9 million from 74.1 million in the prior year. See “—Liquidity and Capital Resources—Dividends and Stock
Transactions” for a description of the Tender Offer and related share repurchase from Artal Holdings.
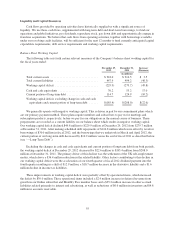
Components of Revenue and Volumes
We derive our revenues principally from meeting fees, Internet revenues, products sold in meetings, and
licensed products sold in retail channels. In addition, we generate other revenue from royalties paid to us by our
franchisees, subscriptions to our branded magazines, and advertising in our publications.
Meeting Fees
Global meeting fees for fiscal 2012 were $934.9 million, a decrease of $55.4 million, or 5.6%, from $990.3
million in the prior year. Excluding the impact of foreign currency, which decreased our global meeting fees for
fiscal 2012 by $12.2 million, global meeting fees in fiscal 2012 decreased by 4.4% versus the prior year. The
decline in meeting fees was driven by a 5.4% decline in global meeting paid weeks in fiscal 2012 to 99.2 million
from 104.8 million in the prior year. The decline in meeting paid weeks was driven by lower enrollments in fiscal
2012 as compared to the high enrollment levels in the prior year. However, the impact of enrollments on meeting
paid weeks was minimized by the higher meeting membership base at the beginning of fiscal 2012 versus the
beginning of fiscal 2011. Global attendance decreased 11.0% to 50.7 million in fiscal 2012 from 57.0 million in
fiscal 2011.
In NACO, meeting fees in fiscal 2012 were $653.4 million, a decrease of $33.4 million, or 4.9%, from
$686.8 million in fiscal 2011. The decline in meeting fees was driven primarily by a 5.6% decline in NACO
meeting paid weeks from 69.9 million in fiscal 2011 to 66.0 million in fiscal 2012. The decline in meeting paid
weeks primarily resulted from lower enrollments in fiscal 2012 as compared to the high enrollment levels in the
prior year. Lower enrollments in fiscal 2012 were driven in part by the execution challenges associated with
introducing Monthly Pass to the small accounts portion of NACO’s corporate business. However, the impact of
enrollments on meeting paid weeks was minimized by the higher meeting membership base at the beginning of
fiscal 2012 versus the beginning of fiscal 2011. In fiscal 2012, NACO attendance decreased 11.4% to
31.9 million from 36.0 million in fiscal 2011. Franchise acquisitions had a de minimus impact on NACO meeting
fees and metrics in fiscal 2012.
International meeting fees in fiscal 2012 were $281.5 million, a decrease of $22.0 million, or 7.2%, from
$303.5 million in the prior year. Excluding the impact of foreign currency, which decreased international meeting
fees for fiscal 2012 by $11.6 million, international meeting fees declined by 3.4% in fiscal 2012 versus the prior
year. In fiscal 2012, the decline in meeting fees was driven by a 4.9% decline in international meeting paid weeks
in the year versus the prior year. Meeting paid weeks performance in fiscal 2012 was driven by declines in
enrollments in our international English-speaking markets in the year versus the prior year, which were partially
offset by enrollment growth in Continental Europe. International attendance decreased by 10.5% in fiscal 2012
versus the prior year.
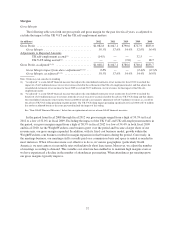
In fiscal 2012, UK meeting fees decreased by 11.7% to $104.4 million from $118.3 million in fiscal 2011.
Excluding the impact of foreign currency, which decreased UK meeting fees for fiscal 2012 by $1.5 million, UK
meeting fees declined by 10.5% in fiscal 2012 versus the prior year. Fiscal 2012 meeting fees were driven lower
primarily by a decline of 11.3% in UK meeting paid weeks versus the prior year. Meeting paid weeks
performance in fiscal 2012 was driven by lower enrollments in the period as compared to the high enrollment
levels in the prior year. In addition, in fiscal 2012, the United Kingdom introduced an advertising campaign that
was ineffective in driving enrollment growth. Weak macro-economic trends in the United Kingdom also
contributed to the decline in enrollments. However, the impact of enrollments on meeting paid weeks was
minimized by the higher meeting membership base at the beginning of fiscal 2012 versus the beginning of fiscal
2011. UK attendance decreased by 16.5% in fiscal 2012 versus the prior year.
45