WeightWatchers 2012 Annual Report Download - page 53
Download and view the complete annual report
Please find page 53 of the 2012 WeightWatchers annual report below. You can navigate through the pages in the report by either clicking on the pages listed below, or by using the keyword search tool below to find specific information within the annual report.-
 1
1 -
2
-
3
-
4
-
5
-
6
-
7
-
8
-
9
-
10
-
11
-
12
-
13
-
14
-
15
-
16
-
17
-
18
-
19
-
20
-
21
-
22
-
23
-
24
-
25
-
26
-
27
-
28
-
29
-
30
-
31
-
32
-
33
-
34
-
35
-
36
-
37
-
38
-
39
-
40
-
41
-
42
-
 43
43 -
 44
44 -
 45
45 -
 46
46 -
 47
47 -
 48
48 -
 49
49 -
 50
50 -
 51
51 -
 52
52 -
 53
53 -
 54
54 -
 55
55 -
 56
56 -
 57
57 -
 58
58 -
 59
59 -
 60
60 -
 61
61 -
 62
62 -
 63
63 -
64
-
65
-
66
-
67
-
68
-
69
-
70
-
71
-
72
-
73
-
74
-
75
-
76
-
77
-
78
-
79
-
80
-
81
-
82
-
83
-
84
-
85
-
86
-
87
-
88
-
89
-
90
-
91
-
92
-
93
-
94
-
95
-
96
-
97
-
98
-
99
-
100
-
101
-
102
-
103
-
104
-
105
-
106
-
107
-
108
-
109
-
110
-
111
-
112
-
113
-
114
-
115
-
116
-
117
-
118
-
119
-
120
-
121
-
122
-
123
-
124
-
125
-
126
-
127
-
128
-
129
-
130
-
131
-
132
 |
 |

Margins
Gross Margin
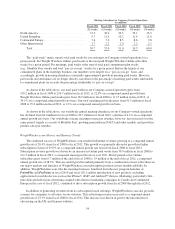
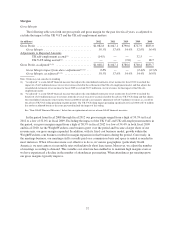
The following table sets forth our gross profit and gross margin for the past five fiscal years, as adjusted to
exclude the impact of the UK VAT and the UK self-employment matters:
(in millions) 2012 2011 2010 2009 2008
Gross Profit ..................................... $1,082.8 $1,047.1 $790.6 $727.9 $835.0
Gross Margin ................................ 59.3% 57.6% 54.4% 52.0% 54.4%
Adjustments to Reported Amounts
UK self-employment accrual(1) .............. (14.5) — — 32.5 —
UK VAT ruling accrual(2) ................... — — (2.0) — 18.7
Gross Profit, as adjusted(1) (2) ........................ $1,068.2 $1,047.1 $788.6 $760.4 $853.7
Gross Margin impact from above adjustments(1) (2) ... 0.8% — — (2.4)% (0.5)%
Gross Margin, as adjusted(1) (2) .................. 58.5% 57.6% 54.4% 54.4% 54.9%
Note: Totals may not sum due to rounding
(1) “As adjusted” is a non-GAAP financial measure that adjusts the consolidated statements of net income for fiscal 2012 to exclude the
impact of a $14.5 million decrease to cost of revenues related to the settlement of the UK self-employment matter and that adjusts the
consolidated statements of net income for fiscal 2009 to exclude $32.5 million in cost of revenues for the impact of the UK self-
employment matter.
(2) “As adjusted” is a non-GAAP financial measure that adjusts the consolidated statements of net income for fiscal 2010 to exclude the
benefit of a $2.0 million increase to revenues from the reversal of an over-accrual related to the adverse UK VAT ruling and that adjusts
the consolidated statements of net income for fiscal 2008 to include a net negative adjustment of $18.7 million to revenues as a result of
the adverse UK VAT ruling pertaining to prior periods. The UK VAT ruling impact pertaining specifically to fiscal 2008 of $7.8 million
has not been adjusted herein as the years presented include the impact of this ruling.
See “Non-GAAP Financial Measures” below for an explanation of our use of non-GAAP financial measures.
In the period from fiscal 2008 through fiscal 2012 our gross margin ranged from a high of 59.3% in fiscal
2012 to a low of 52.0% in fiscal 2009. Excluding the impact of the UK VAT and UK self-employment matters in
the period, our gross margin ranged from a high of 58.5% in fiscal 2012 to a low of 54.4% in both fiscal 2009
and fiscal 2010. As the WeightWatchers.com business grew over the period and became a larger share of our
revenue mix, our gross margin expanded. In addition, with its fixed cost business model, growth within the
WeightWatchers.com business resulted in margin expansion in that business during the period. Conversely, in
the meetings business, our meetings staff is usually paid on a commission basis and space is rented as needed in
most instances. When it becomes more cost effective to do so, in various geographies (particularly North
America), we rent centers at reasonable rates with relatively short lease terms. Moreover, we adjust the number
of meetings according to demand. This variable cost structure has enabled us to maintain high margins even as
we have experienced a decline in the number of attendances per meeting. When attendances per meeting grow,
our gross margins typically improve.
37