WeightWatchers 2012 Annual Report Download - page 67
Download and view the complete annual report
Please find page 67 of the 2012 WeightWatchers annual report below. You can navigate through the pages in the report by either clicking on the pages listed below, or by using the keyword search tool below to find specific information within the annual report.-
 1
1 -
2
-
3
-
4
-
5
-
6
-
7
-
8
-
9
-
10
-
11
-
12
-
13
-
14
-
15
-
16
-
17
-
18
-
19
-
20
-
21
-
22
-
23
-
24
-
25
-
26
-
27
-
28
-
29
-
30
-
31
-
32
-
33
-
34
-
35
-
36
-
37
-
38
-
39
-
40
-
41
-
42
-
43
-
44
-
45
-
46
-
47
-
48
-
49
-
50
-
51
-
52
-
53
-
54
-
55
-
56
-
 57
57 -
 58
58 -
 59
59 -
 60
60 -
 61
61 -
 62
62 -
 63
63 -
 64
64 -
 65
65 -
 66
66 -
 67
67 -
 68
68 -
 69
69 -
 70
70 -
 71
71 -
 72
72 -
 73
73 -
 74
74 -
 75
75 -
 76
76 -
 77
77 -
78
-
79
-
80
-
81
-
82
-
83
-
84
-
85
-
86
-
87
-
88
-
89
-
90
-
91
-
92
-
93
-
94
-
95
-
96
-
97
-
98
-
99
-
100
-
101
-
102
-
103
-
104
-
105
-
106
-
107
-
108
-
109
-
110
-
111
-
112
-
113
-
114
-
115
-
116
-
117
-
118
-
119
-
120
-
121
-
122
-
123
-
124
-
125
-
126
-
127
-
128
-
129
-
130
-
131
-
132
 |
 |
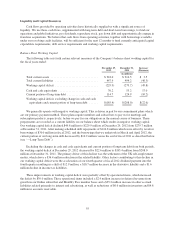
should be noted that fiscal 2010 included $6.5 million of expense, included in both cost of revenues and selling,
general and administrative expense, associated with the previously disclosed settlement of a California litigation,
which lowered our operating income margin by 45 basis points in fiscal 2010.
Net Income and Earnings Per Share
The benefits derived from operating income growth, along with lower interest expense, resulted in net
income growth in fiscal 2011 of 57.0% versus the prior year to $304.9 million, up from $194.2 million in fiscal
2010. Earnings per fully diluted share in fiscal 2011 were $4.11, up $1.55 from $2.56 in fiscal 2010. The 2011
earnings per fully diluted share included a $0.05 tax benefit associated with the closing of our Finland business,
while the 2010 earnings per fully diluted share included a $0.02 revenue benefit from the UK VAT reversal and a
$0.05 charge associated with the previously disclosed settlement of a California litigation. In addition, foreign
currency provided a $0.10 benefit per fully diluted share in fiscal 2011.
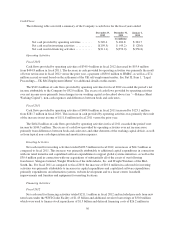
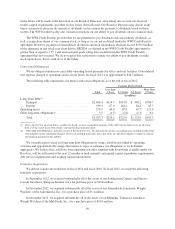
Components of Revenue and Volumes
We derive our revenues principally from meeting fees, products sold in meetings, Internet revenues, and
licensed products sold in retail channels. In addition, we generate other revenue from royalties paid to us by our
franchisees, subscriptions to our branded magazines, and advertising in our publications.
Meeting Fees
Global meeting fees for fiscal 2011 were $990.3 million, an increase of $170.7 million, or 20.8%, from
$819.6 million in the prior year. After the $2.0 million adjustment to fiscal 2010 global meeting fees for the UK
VAT accrual reversal noted above, fiscal 2011 revenues of $990.3 million would have been $172.7 million, or
21.1% above the prior year. Excluding the impact of foreign currency, which increased our global meeting fees
by $19.6 million, global meeting fees in fiscal 2011 increased 18.4% versus the prior year as a result of strong
enrollment growth. The new program launches in our North American and UK markets in late fiscal 2010,
combined with effective marketing and public relations throughout the period, were the key drivers of this
growth during fiscal 2011. In addition, the number and proportion of our new and existing meeting members
purchasing Monthly Pass increased in fiscal 2011 versus the prior year. Monthly Pass purchasers have a longer
tenure, and accordingly, contribute higher lifetime revenue on average than those who pay for attendance on a
week-to-week basis.
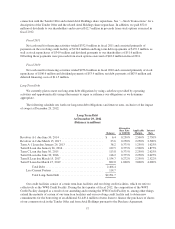
As a result of the enrollment strength and the increase in Monthly Pass purchasers, global meeting paid
weeks rose 19.2% to 104.8 million in fiscal 2011, up from 87.9 million in the prior year. This growth rate in
meeting paid weeks marks a significant improvement from the low growth rates experienced on average
throughout fiscal 2010. Global attendance in our meetings business increased by 11.9% to 57.0 million in fiscal
2011, from 51.0 million in fiscal 2010. In our North American and UK markets, the new programs not only
attracted new customers to the meetings business, but also increased meeting attendance by our existing
members. In fiscal 2011, our Continental European market experienced paid weeks and attendance declines
versus fiscal 2010, as a result of cycling against a new program launch in the prior year. This market is still in the
process of developing effective marketing campaigns.
In NACO, meeting fees in fiscal 2011 were $686.8 million, an increase of $141.5 million, or 25.9%, from
$545.3 million in fiscal 2010. Excluding the impact of foreign currency, which increased NACO meeting fees by
$2.1 million, NACO meeting fees grew by 25.6% in fiscal 2011 versus the prior year. Meeting fees grew
primarily from the positive impact on enrollments of the highly successful PointsPlus program, which launched
in late fiscal 2010, our effective marketing campaign strategy which has raised the profile and attraction of our
offerings to both former members and new customers, and increased purchases of the Monthly Pass commitment
plan. As a result of these factors, NACO meeting paid weeks increased 26.4% in fiscal 2011 versus the prior year
to 69.9 million, and attendance grew 18.8% in fiscal 2011 versus the prior year to 36.0 million. In the fourth
51