WeightWatchers 2012 Annual Report Download - page 65
Download and view the complete annual report
Please find page 65 of the 2012 WeightWatchers annual report below. You can navigate through the pages in the report by either clicking on the pages listed below, or by using the keyword search tool below to find specific information within the annual report.-
 1
1 -
2
-
3
-
4
-
5
-
6
-
7
-
8
-
9
-
10
-
11
-
12
-
13
-
14
-
15
-
16
-
17
-
18
-
19
-
20
-
21
-
22
-
23
-
24
-
25
-
26
-
27
-
28
-
29
-
30
-
31
-
32
-
33
-
34
-
35
-
36
-
37
-
38
-
39
-
40
-
41
-
42
-
43
-
44
-
45
-
46
-
47
-
48
-
49
-
50
-
51
-
52
-
53
-
54
-
 55
55 -
 56
56 -
 57
57 -
 58
58 -
 59
59 -
 60
60 -
 61
61 -
 62
62 -
 63
63 -
 64
64 -
 65
65 -
 66
66 -
 67
67 -
 68
68 -
 69
69 -
 70
70 -
 71
71 -
 72
72 -
 73
73 -
 74
74 -
 75
75 -
76
-
77
-
78
-
79
-
80
-
81
-
82
-
83
-
84
-
85
-
86
-
87
-
88
-
89
-
90
-
91
-
92
-
93
-
94
-
95
-
96
-
97
-
98
-
99
-
100
-
101
-
102
-
103
-
104
-
105
-
106
-
107
-
108
-
109
-
110
-
111
-
112
-
113
-
114
-
115
-
116
-
117
-
118
-
119
-
120
-
121
-
122
-
123
-
124
-
125
-
126
-
127
-
128
-
129
-
130
-
131
-
132
 |
 |

and volumes grew in all four quarters of fiscal 2011 as compared to the prior year periods. For the full year of
fiscal 2011, revenues increased 25.3% and paid weeks increased 37.3% versus the prior year. Our gross margin
for fiscal 2011 improved to 57.6%, up from 54.4% in fiscal 2010.
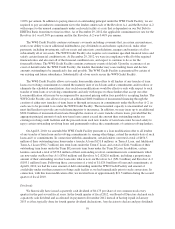
The table below sets forth selected financial information for fiscal 2011 from our consolidated statements of
income for fiscal 2011 versus selected financial information for fiscal 2010 from our consolidated statements of
income for fiscal 2010 on both a reported basis and an adjusted basis. Results for fiscal 2010 are adjusted to
exclude the $2.0 million benefit to revenue of an over-accrual related to the previously disclosed adverse UK
VAT tax ruling in the second quarter of fiscal 2008. See “Non-GAAP Financial Measures” above.
Summary of Selected Financial Data as Reported and Adjusted
(In millions, except per share amounts)
Fiscal
2011
Fiscal
2010
Increase/
(Decrease)
%
Change
Revenues, net (as adjusted)(1) ............................. $1,819.2 $1,450.0 $369.2 25.5%
UK VAT ruling accrual reversal(1) ..................... — 2.0 (2.0)
Revenues, net of VAT ruling ............................. 1,819.2 1,452.0 367.2 25.3%
Cost of revenues ....................................... 772.0 661.4 110.6 16.7%
Gross Profit ................................... 1,047.1 790.6 256.5 32.4%
Gross Margin % ............................... 57.6% 54.4%
Marketing expenses ..................................... 292.4 217.1 75.2 34.6%
Selling, general & administrative expenses .................. 208.5 183.2 25.3 13.8%
Operating income .............................. 546.3 390.3 156.0 40.0%
Operating Income Margin % ..................... 30.0% 26.9%
Interest expense ........................................ 59.9 76.2 (16.4) (21.5%)
Other expense (income), net .............................. 3.4 0.9 2.4 100.0%
Income before income taxes ...................... 483.1 313.2 170.1 54.3%
Provision for income taxes ............................... 178.7 120.7 58.1 48.1%
Net income ................................... 304.3 192.5 111.8 58.1%
Net loss attributable to the noncontrolling interest ............. 0.5 1.7 (1.2) (69.5%)
Net income attributable to the Company ............ $ 304.9 $ 194.2 $110.6 57.0%
Weighted average diluted shares outstanding ................. 74.1 75.9 (1.7) (2.3%)
Diluted EPS ........................................... $ 4.11 $ 2.56 $ 1.55 60.7%
Note: Totals may not sum due to rounding
(1) “As adjusted” is a non-GAAP financial measure that adjusts the consolidated statements of income for fiscal
2010 to exclude the benefit of a $2.0 million increase to revenues from the reversal of an over-accrual
related to the adverse UK VAT ruling. See “Non-GAAP Financial Measures” above for an explanation of
our use of non-GAAP financial measures.
49