WeightWatchers 2012 Annual Report Download - page 110
Download and view the complete annual report
Please find page 110 of the 2012 WeightWatchers annual report below. You can navigate through the pages in the report by either clicking on the pages listed below, or by using the keyword search tool below to find specific information within the annual report.-
 1
1 -
2
-
3
-
4
-
5
-
6
-
7
-
8
-
9
-
10
-
11
-
12
-
13
-
14
-
15
-
16
-
17
-
18
-
19
-
20
-
21
-
22
-
23
-
24
-
25
-
26
-
27
-
28
-
29
-
30
-
31
-
32
-
33
-
34
-
35
-
36
-
37
-
38
-
39
-
40
-
41
-
42
-
43
-
44
-
45
-
46
-
47
-
48
-
49
-
50
-
51
-
52
-
53
-
54
-
55
-
56
-
57
-
58
-
59
-
60
-
61
-
62
-
63
-
64
-
65
-
66
-
67
-
68
-
69
-
70
-
71
-
72
-
73
-
74
-
75
-
76
-
77
-
78
-
79
-
80
-
81
-
82
-
83
-
84
-
85
-
86
-
87
-
88
-
89
-
90
-
91
-
92
-
93
-
94
-
95
-
96
-
97
-
98
-
99
-
 100
100 -
 101
101 -
 102
102 -
 103
103 -
 104
104 -
 105
105 -
 106
106 -
 107
107 -
 108
108 -
 109
109 -
 110
110 -
 111
111 -
 112
112 -
 113
113 -
 114
114 -
 115
115 -
 116
116 -
 117
117 -
 118
118 -
 119
119 -
 120
120 -
121
-
122
-
123
-
124
-
125
-
126
-
127
-
128
-
129
-
130
-
131
-
132
 |
 |

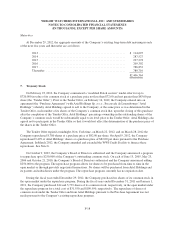
WEIGHT WATCHERS INTERNATIONAL, INC. AND SUBSIDIARIES
NOTES TO CONSOLIDATED FINANCIAL STATEMENTS
(IN THOUSANDS, EXCEPT PER SHARE AMOUNTS)
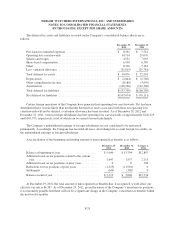
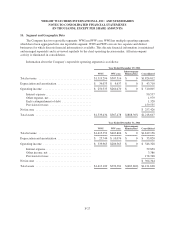
Year Ended January 1, 2011
WWI WW.com
Intercompany
Eliminations Consolidated
Total revenue .................................... $1,210,995 $241,042 $ 0 $1,452,037
Depreciation and amortization ....................... $ 25,675 $ 7,996 $ 0 $ 33,671
Operating income ................................. $ 280,337 $110,008 $ 0 $ 390,345
Interest expense ............................... 76,204
Other expense, net ............................. 963
Provision for taxes ............................ 120,656
Net income ...................................... $ 192,522
Total assets ...................................... $1,389,402 $273,306 $(570,721) $1,091,987
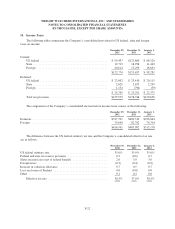
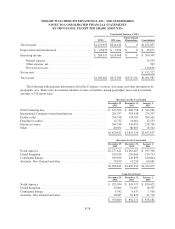
The following table presents information about the Company’s sources of revenue and other information by
geographic area. There were no material amounts of sales or transfers among geographic areas and no material
amounts of US export sales.
Revenues for the Year Ended
December 29,
2012
December 31,
2011
January 1,
2011
NACO meeting fees ......................................... $ 653,396 $ 686,758 $ 545,289
International Company-owned meeting fees ...................... 281,537 303,538 274,357
Product sales .............................................. 294,758 334,303 304,961
Franchise royalties .......................................... 12,732 14,461 12,133
Internet revenues ........................................... 504,338 399,495 238,756
Other .................................................... 80,051 80,601 76,541
$1,826,812 $1,819,156 $1,452,037
Revenues for the Year Ended
December 29,
2012
December 31,
2011
January 1,
2011
North America ............................................. $1,277,621 $1,261,407 $ 957,598
United Kingdom ............................................ 199,916 220,666 176,714
Continental Europe ......................................... 269,636 245,859 250,844
Australia, New Zealand and other .............................. 79,639 91,224 66,881
$1,826,812 $1,819,156 $1,452,037
Long-Lived Assets
December 29,
2012
December 31,
2011
January 1,
2011
North America ............................................. $ 922,034 $ 845,197 $ 830,422
United Kingdom ............................................ 19,006 19,067 18,535
Continental Europe ......................................... 9,342 8,437 7,506
Australia, New Zealand and other .............................. 20,287 19,870 21,718
$ 970,669 $ 892,571 $ 878,181
F-28