WeightWatchers 2012 Annual Report Download - page 47
Download and view the complete annual report
Please find page 47 of the 2012 WeightWatchers annual report below. You can navigate through the pages in the report by either clicking on the pages listed below, or by using the keyword search tool below to find specific information within the annual report.
Item 7. Management’s Discussion and Analysis of Financial Condition and Results of Operations
You should read the following discussion in conjunction with the “Selected Financial Data” included in
Item 6 of this Annual Report on Form 10-K and our consolidated financial statements and related notes included
in Item 15 of this Annual Report on Form 10-K. This discussion contains forward-looking statements that involve
risks and uncertainties, such as statements of our plans, objectives, expectations and intentions. The cautionary
statements discussed in “Cautionary Notice Regarding Forward-Looking Statements” and elsewhere in this
Annual Report on Form 10-K should be read as applying to all forward-looking statements wherever they appear
in this Annual Report on Form 10-K. Our actual results could differ materially from those discussed here.
Factors that could cause or contribute to these differences include, without limitation, those discussed in
“Risk Factors” included in Item 1A of this Annual Report on Form 10-K.
Overview
We derive our revenues principally from:
•Meeting fees. Members pay us fees to attend our weekly meetings.
•Internet revenues. We generate revenue from our Internet subscription products and from the sale of
third-party Internet advertising.
•In-meeting product sales. We sell a range of products that complement our weight management plans,
such as bars, snacks, cookbooks, food and restaurant guides with PointsPlus values, Weight Watchers
magazines, PointsPlus calculators and ActiveLink activity monitors, to members in our meetings.
•Licensing, franchise royalties and other. We license the Weight Watchers brand and our other
intellectual property in certain categories of foods and other relevant consumer products. We also
endorse carefully selected branded consumer products. In addition, our franchisees typically pay us a
royalty fee of 10% of their meeting fee revenues as well as purchase products for sale in their meetings.
We also generate revenues from subscriptions for our magazines and third-party advertising in our
publications.
We currently have two reporting segments: Weight Watchers International and WeightWatchers.com. All
sources of revenue, other than Internet revenues, are included in our Weight Watchers International reporting
segment. Over the past several years the mix of our revenues has shifted more toward our WeightWatchers.com
reporting segment and away from our Weight Watchers International reporting segment. Revenues from our
Weight Watchers International reporting segment contributed 72.2% of our total revenues in fiscal 2012, 77.8%
of our total revenues in fiscal 2011, and 83.4% of our total revenues in fiscal 2010. Revenues from our
WeightWatchers.com reporting segment contributed 27.8% of our total revenues in fiscal 2012, 22.2% of our
total revenues in fiscal 2011, and 16.6% of our total revenues in fiscal 2010.
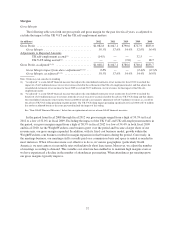
The following table sets forth our revenues by category for the past five fiscal years.
Revenue Sources
(in millions)
Fiscal 2012 Fiscal 2011 Fiscal 2010 Fiscal 2009 Fiscal 2008
(52 weeks) (52 weeks) (52 weeks) (52 weeks) (53 weeks)
Meetings fees ................................ $ 934.9 $ 990.3 $ 819.6 $ 817.5 $ 908.1
Internet revenues ............................. 504.3 399.5 238.8 196.0 185.8
In-meeting product sales ....................... 253.2 281.8 260.5 251.3 285.6
Licensing, franchise royalties and other ........... 134.4 147.6 133.1 134.1 156.3
Total ....................................... $1,826.8 $1,819.2 $1,452.0 $1,398.9 $1,535.8
31


