WeightWatchers 2012 Annual Report Download - page 50
Download and view the complete annual report
Please find page 50 of the 2012 WeightWatchers annual report below. You can navigate through the pages in the report by either clicking on the pages listed below, or by using the keyword search tool below to find specific information within the annual report.-
 1
1 -
2
-
3
-
4
-
5
-
6
-
7
-
8
-
9
-
10
-
11
-
12
-
13
-
14
-
15
-
16
-
17
-
18
-
19
-
20
-
21
-
22
-
23
-
24
-
25
-
26
-
27
-
28
-
29
-
30
-
31
-
32
-
33
-
34
-
35
-
36
-
37
-
38
-
39
-
 40
40 -
 41
41 -
 42
42 -
 43
43 -
 44
44 -
 45
45 -
 46
46 -
 47
47 -
 48
48 -
 49
49 -
 50
50 -
 51
51 -
 52
52 -
 53
53 -
 54
54 -
 55
55 -
 56
56 -
 57
57 -
 58
58 -
 59
59 -
 60
60 -
61
-
62
-
63
-
64
-
65
-
66
-
67
-
68
-
69
-
70
-
71
-
72
-
73
-
74
-
75
-
76
-
77
-
78
-
79
-
80
-
81
-
82
-
83
-
84
-
85
-
86
-
87
-
88
-
89
-
90
-
91
-
92
-
93
-
94
-
95
-
96
-
97
-
98
-
99
-
100
-
101
-
102
-
103
-
104
-
105
-
106
-
107
-
108
-
109
-
110
-
111
-
112
-
113
-
114
-
115
-
116
-
117
-
118
-
119
-
120
-
121
-
122
-
123
-
124
-
125
-
126
-
127
-
128
-
129
-
130
-
131
-
132
 |
 |

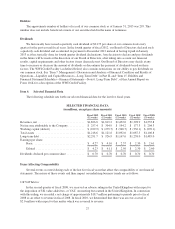
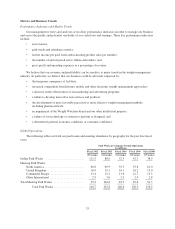
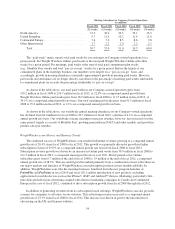
Meeting Attendance in Company-Owned Operations
(in millions)
Fiscal 2012 Fiscal 2011 Fiscal 2010 Fiscal 2009 Fiscal 2008
(52 weeks) (52 weeks) (52 weeks) (52 weeks) (53 weeks)
North America ............................... 31.9 36.0 30.3 32.1 36.5
United Kingdom ............................. 9.7 11.6 10.2 11.4 11.6
Continental Europe ........................... 7.4 7.2 8.5 8.6 9.8
Other International ........................... 1.7 2.2 2.0 2.2 2.1
Total ................................... 50.7 57.0 51.0 54.3 60.0
The “paid week” metric reports total paid weeks by our customers in Company-owned operations for a
given period. For Weight Watchers Online, paid weeks is the total paid Weight Watchers Online subscriber
weeks for a given period. For meetings, paid weeks is the sum of total paid commitment plan weeks
(e.g., Monthly Pass weeks) and total “pay-as-you-go” weeks for a given period. Before the launch of our
commitment plans in the meetings business, our members were largely on a “pay-as-you-go” basis, and
accordingly, growth in meeting attendance essentially approximated growth in meeting paid weeks. However,
paid weeks and attendance are no longer directly correlated as the percentage of meeting paid weeks attributable
to commitment plans far exceeds the percentage attributable to “pay-as-you-go”.
As shown in the table above, our total paid weeks in our Company-owned operations grew from
130.2 million in fiscal 2008 to 210.7 million in fiscal 2012, or 12.8% on a compound annual growth basis.
Weight Watchers Online paid weeks grew from 38.9 million in fiscal 2008 to 111.5 million in fiscal 2012, or
30.1% on a compound annual growth rate basis. Our total meeting paid weeks grew from 91.3 million in fiscal
2008 to 99.2 million in fiscal 2012, or 2.1% on a compound annual growth rate basis.
As shown in the table above, our worldwide annual meeting attendance in our Company-owned operations
has declined from 60.0 million for fiscal 2008 to 50.7 million for fiscal 2012, a decline of 4.1% on a compound
annual growth rate basis. Our worldwide average meeting revenue per attendee, however, has increased over the
same period, largely as a result of Monthly Pass’ growing penetration in NACO and other markets and growth in
product sales per attendee.
WeightWatchers.com Metrics and Business Trends
The continued success of WeightWatchers.com resulted in Internet revenues growing at a compound annual
growth rate of 28.4% from fiscal 2008 to fiscal 2012. This growth was primarily driven by growth in Online
subscription revenue of 29.6% on a compound annual growth rate basis from fiscal 2008 to fiscal 2012.
Subscription revenue growth was driven by an increase in Online paid weeks from 38.9 million in fiscal 2008 to
111.5 million in fiscal 2012, a compound annual growth rate of over 30%. End of period active Online
subscribers grew from 0.7 million at the end of fiscal 2008 to 1.9 million at the end of fiscal 2012, a compound
annual growth rate of 28.9%. This successful growth resulted primarily from a combination of new subscribers in
our major markets and launches of WeightWatchers.com subscription products in new markets globally. In
addition, WeightWatchers.com, like the meetings business, benefited from the new program launches of
PointsPlus and ProPoints in fiscal 2010 and fiscal 2011 and the introduction of new products, including
applications for mobile devices such as the iPhone®, iPad®and Android™ devices. Marketing, particularly first-
time dedicated television advertising coupled with effective marketing campaigns in Canada and Continental
Europe in the case of fiscal 2012, continued to drive subscription growth from fiscal 2008 through fiscal 2012.
In addition to generating revenues from its subscription based offerings, WeightWatchers.com also provides
a means for companies to advertise on our websites. This advertising revenue increased at a compound annual
growth rate of 13.3% from fiscal 2008 to fiscal 2012. This increase was driven in part by the introduction of
advertising on the UK and German websites.
34