WeightWatchers 2012 Annual Report Download - page 70
Download and view the complete annual report
Please find page 70 of the 2012 WeightWatchers annual report below. You can navigate through the pages in the report by either clicking on the pages listed below, or by using the keyword search tool below to find specific information within the annual report.-
 1
1 -
2
-
3
-
4
-
5
-
6
-
7
-
8
-
9
-
10
-
11
-
12
-
13
-
14
-
15
-
16
-
17
-
18
-
19
-
20
-
21
-
22
-
23
-
24
-
25
-
26
-
27
-
28
-
29
-
30
-
31
-
32
-
33
-
34
-
35
-
36
-
37
-
38
-
39
-
40
-
41
-
42
-
43
-
44
-
45
-
46
-
47
-
48
-
49
-
50
-
51
-
52
-
53
-
54
-
55
-
56
-
57
-
58
-
59
-
 60
60 -
 61
61 -
 62
62 -
 63
63 -
 64
64 -
 65
65 -
 66
66 -
 67
67 -
 68
68 -
 69
69 -
 70
70 -
 71
71 -
 72
72 -
 73
73 -
 74
74 -
 75
75 -
 76
76 -
 77
77 -
 78
78 -
 79
79 -
 80
80 -
81
-
82
-
83
-
84
-
85
-
86
-
87
-
88
-
89
-
90
-
91
-
92
-
93
-
94
-
95
-
96
-
97
-
98
-
99
-
100
-
101
-
102
-
103
-
104
-
105
-
106
-
107
-
108
-
109
-
110
-
111
-
112
-
113
-
114
-
115
-
116
-
117
-
118
-
119
-
120
-
121
-
122
-
123
-
124
-
125
-
126
-
127
-
128
-
129
-
130
-
131
-
132
 |
 |
Notwithstanding all of these strategies and initiatives, our marketing acquisition cost per customer declined
by 1.7%, or 3.2% on a constant currency basis in fiscal 2011 versus the prior year. Our marketing expenses as a
percentage of revenues were 16.1% in fiscal 2011 as compared to 15.0% in the prior year, as the revenues from
more recent customer acquisitions will accrue over future periods.
Selling, General and Administrative
Selling, general and administrative expenses were $208.5 million for fiscal 2011 versus $183.2 million for
fiscal 2010, an increase of $25.3 million, or 13.8%. On a constant currency basis, selling, general and
administrative expenses for fiscal 2011 increased by 11.2% versus fiscal 2010. The largest component of the
increase was salary related, reflecting higher bonus expense associated with our strong business performance in
fiscal 2011. In addition, fiscal 2011 included expense related to growth initiatives including new business
development and technology for the development of our mobile platforms. Selling, general and administrative
expenses as a percentage of revenues for fiscal 2011 decreased by 120 basis points to 11.5% from 12.6% for
fiscal 2010. It should be noted that fiscal 2010 included $4.9 million of selling, general and administrative
expense associated with the previously disclosed settlement of a California litigation, which accounted for 34
basis points of the 120 basis point decrease in selling, general and administrative expenses as a percentage of
revenues when comparing fiscal 2011 to the prior year.
Operating Income Margin
Our operating income margin in fiscal 2011 increased to 30.0%, up 310 basis points from 26.9% in fiscal
2010. Our operating income margin in fiscal 2010 decreased by 45 basis points as a result of the $6.5 million
charge, included in both cost of revenues and selling, general and administrative expense, associated with the
previously disclosed settlement of a California litigation. Margin expansion in fiscal 2011 was attributable to the
favorable impact on gross margin of operating leverage gained from higher attendances per meeting and strong
growth in our higher margin WeightWatchers.com business, where cost of revenues is largely fixed. Marketing
expense increased as a percentage of revenues in fiscal 2011 as compared to the prior year, but was offset by the
decline in selling, general and administrative expenses as a percentage of revenues in fiscal 2011 as compared to
the prior year.
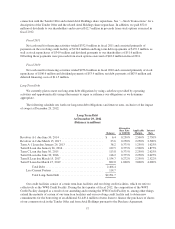
Interest Expense and Other
Interest expense was $59.9 million for fiscal 2011, a decrease of $16.4 million, or 21.5%, from $76.2
million in fiscal 2010. Our average debt outstanding decreased in fiscal 2011 to $1,183 million as compared to
$1,415 million in fiscal 2010, including $197.5 million of scheduled repayments since January 2011. In addition,
the notional value of our interest rate swaps declined, driving a lower effective interest rate, to 4.62% in fiscal
2011 versus 5.01% in fiscal 2010.
We reported $3.4 million of other expense in fiscal 2011 as compared to $0.9 million of other expense in
fiscal 2010, primarily reflecting the impact of foreign currency on intercompany transactions.
Tax
Our effective tax rate was 37.0% for fiscal 2011 as compared to 38.5% for fiscal 2010. For fiscal 2011, we
recorded a tax benefit associated with the closure of our Finland business. Excluding this benefit, our effective
tax rate for fiscal 2011 would have been 37.8%. The difference in period-over-period effective tax rates after this
adjustment is primarily due to the benefit of reversing certain tax reserves upon the expiration of the applicable
statutes of limitations.
54