WeightWatchers 2012 Annual Report Download - page 48
Download and view the complete annual report
Please find page 48 of the 2012 WeightWatchers annual report below. You can navigate through the pages in the report by either clicking on the pages listed below, or by using the keyword search tool below to find specific information within the annual report.-
 1
1 -
2
-
3
-
4
-
5
-
6
-
7
-
8
-
9
-
10
-
11
-
12
-
13
-
14
-
15
-
16
-
17
-
18
-
19
-
20
-
21
-
22
-
23
-
24
-
25
-
26
-
27
-
28
-
29
-
30
-
31
-
32
-
33
-
34
-
35
-
36
-
37
-
 38
38 -
 39
39 -
 40
40 -
 41
41 -
 42
42 -
 43
43 -
 44
44 -
 45
45 -
 46
46 -
 47
47 -
 48
48 -
 49
49 -
 50
50 -
 51
51 -
 52
52 -
 53
53 -
 54
54 -
 55
55 -
 56
56 -
 57
57 -
 58
58 -
59
-
60
-
61
-
62
-
63
-
64
-
65
-
66
-
67
-
68
-
69
-
70
-
71
-
72
-
73
-
74
-
75
-
76
-
77
-
78
-
79
-
80
-
81
-
82
-
83
-
84
-
85
-
86
-
87
-
88
-
89
-
90
-
91
-
92
-
93
-
94
-
95
-
96
-
97
-
98
-
99
-
100
-
101
-
102
-
103
-
104
-
105
-
106
-
107
-
108
-
109
-
110
-
111
-
112
-
113
-
114
-
115
-
116
-
117
-
118
-
119
-
120
-
121
-
122
-
123
-
124
-
125
-
126
-
127
-
128
-
129
-
130
-
131
-
132
 |
 |
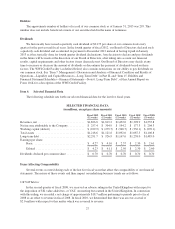
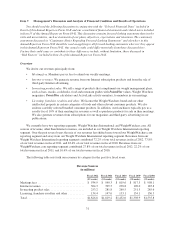
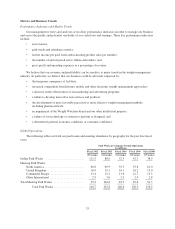
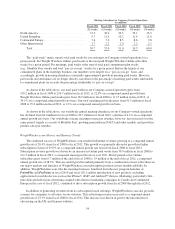
From fiscal 2008 through fiscal 2012, our revenues increased at a compound annual growth rate of 4.4%
primarily driven by paid weeks growth in the WeightWatchers.com business Additional revenue details are as
follows:.
•Meeting fees. From fiscal 2008 through fiscal 2012, meeting fees grew at a compound annual growth
rate of 0.7%, with growth in our UK and NACO meetings businesses being partially offset by declines
in our Continental European meetings business. This increase was driven by growth in our meeting
paid weeks, which grew on a global basis at a compound annual growth rate of 2.1%. The decline in
meeting fees from 2008 to 2009 primarily reflected the impact of the global recession on our ability to
enroll new members. Beginning in NACO in the second quarter of fiscal 2010, year-over-year growth
in recruitment trends, driven by strong new marketing and further fueled by the soft launch in the
fourth quarter of fiscal 2010 of PointsPlus and ProPoints in our English-speaking markets, drove
global meeting fees by the fourth quarter to once again increase versus the comparable prior year
period. The momentum of the new program launches in our English-speaking markets accelerated our
recruitment trends in the first quarter of fiscal 2011, and, supported by strong marketing and public
relations, resulted in global meeting fees that increased in every quarter of fiscal 2011 as compared to
the prior year period. Fiscal 2012 had the challenge of being compared against the high levels of
recruitment growth we experienced in fiscal 2011. Although we entered fiscal 2012 with a higher
meeting membership base than we had at the beginning of fiscal 2011, lower enrollments in all 2012
fiscal quarters resulted in lower meeting fees for the year as compared to the prior year. Lower
enrollments in the meetings business in fiscal 2012 were primarily driven by a decline in the English-
speaking markets as we cycled against the momentum of their program innovations in the prior year.
•Internet Revenues. From fiscal 2008 through fiscal 2012, our Internet revenues grew at a compound
annual growth rate of 28.4%. The increase was primarily due to growth in the number of
WeightWatchers.com end of period active Online subscribers which grew by over 1.0 million
subscribers from 678,700 at the end of fiscal 2008 to 1,871,400 at the end of fiscal 2012. This increase
in Online subscribers drove growth in our Online paid weeks, which grew at a compounded annual
growth rate of 30.1%. This increase in Online subscribers and paid weeks, which accelerated in fiscal
2011, was driven primarily by continued strong marketing campaigns which began in the second
quarter of fiscal 2010 in the United States and the United Kingdom, and further benefited from the new
program launches at the end of fiscal 2010. In addition, from fiscal 2008 through fiscal 2011, we had
several new country launches which further drove growth in our subscriber base. In fiscal 2012, first-
time dedicated television advertising coupled with effective marketing campaigns in Canada and
Continental Europe primarily drove strong Online paid weeks growth in these markets.
•In-meeting product sales. Global product sales were down 3.5% on a compound annual growth rate
from fiscal 2008 through fiscal 2012. Our average product sales per attendee in our meetings business
grew from $4.76 to $4.99 at a compound annual growth rate of 1.2% during that period as a result of
successful new product and program launches. However, we experienced a decline in the number of
members attending meetings which drove a decline in our global product sales.
•Licensing revenues. Licensing revenues declined at a compound annual growth rate of 1.5% from fiscal
2008 through fiscal 2012. Despite our increased focus on expanding the number of Weight Watchers
branded and endorsed products worldwide, this revenue category was and remains negatively impacted
by the global economic downturn and the resulting decrease in discretionary spending by consumers
and loss of consumer confidence.
32